usiness Intelligence and Map Visualization ith Oracle Spatial
|
|
|
- Logan Parrish
- 8 years ago
- Views:
Transcription
1 usiness Intelligence and Map Visualization ith Oracle Spatial iva Ravada enior Director of Devlopment racle Spatial and MapViewer

2 siness Intelligence Effective interactive visualization and analysis are key to insight Oracle offers numerous choices

3 atial Analytics Give a Real World Perspective t business data has a location Find all competitors within 2 miles of Northport Branch ELECT c.holding_company, c.location FROM competitor c, bank b WHERE b.site_id = 1604 AND SDO_WITHIN_DISTANCE(c.location,.location, distance=2 unit=mile') = 'TRUE

4 ap driven filters, or prompts, in BI dashboards Possible With Spatial Analytics incidents within 750 ft ected park

5 ery Application is location-aware, aware, not just GIS plications Sales Territory Management Transportation Management Citizen Services Project Management Content Management Asset Management

6 hen are Map views useful Visualizing data related to geographic locations Showing or detecting spatial relationships and patterns Showing lots of data in a relatively small area Drilling down from a (map) overview to a detailed report, chart, or graph
 overview to a")
7 hy Spatial Map Visualizations? Original High-Density Visualization

8 hy Spatial Map Visualizations? stom Territories 2010, NAVTEQ

9 hy Spatial Map Visualizations? l For Master-Detail Analysis 2010, NAVTEQ


10 ew Interactive Visualizations n Insight Quicker with Greater Visibility Rich interactive visualizations Animated transitions Range sliders Paging sliders Master-Detail linking Extensive and extended set of chart types Consistent, hi-fidelity charting across Oracle product line

11 For Example: Business Data Year Plant Location Country Plant Location State Spending Type Spend Suppliers Buyers Invoiced Quantity

12 And Resulting Analysis Spend Country Buyers Year 2010, NAVTEQ oiced Quantity Year Buyers, Suppliers Year Buyers, Suppliers Spending Type

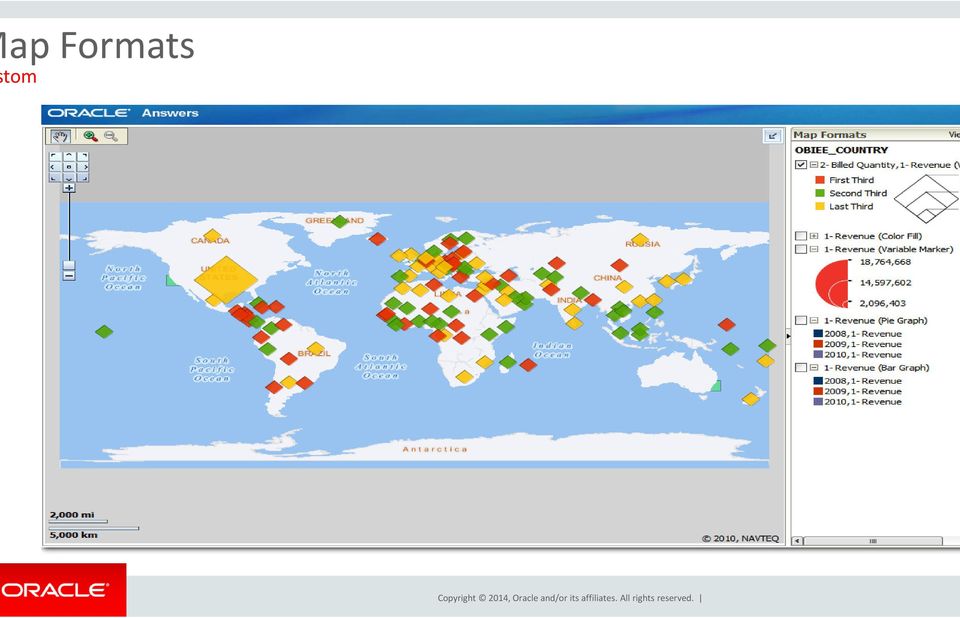
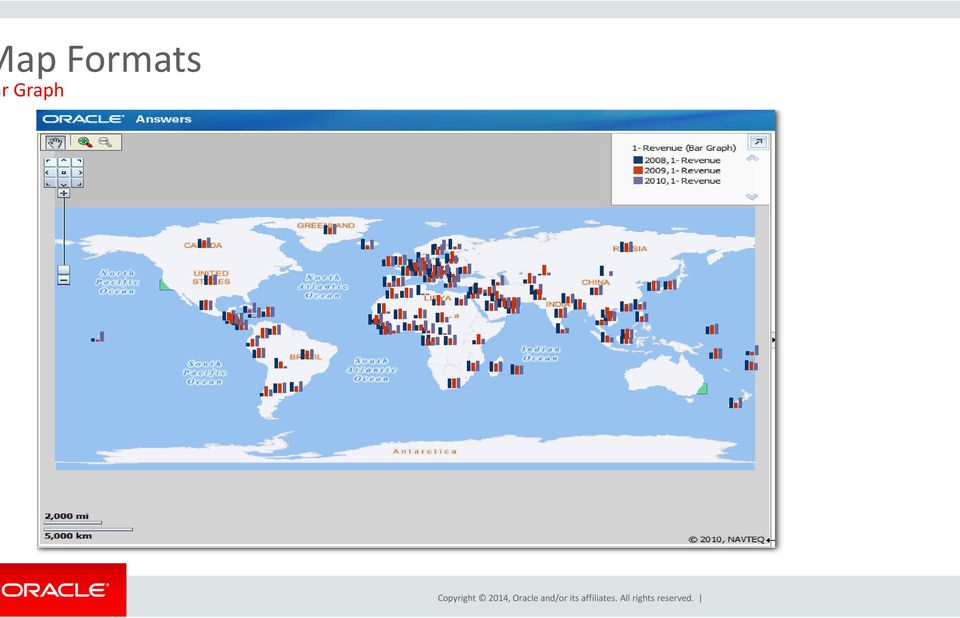
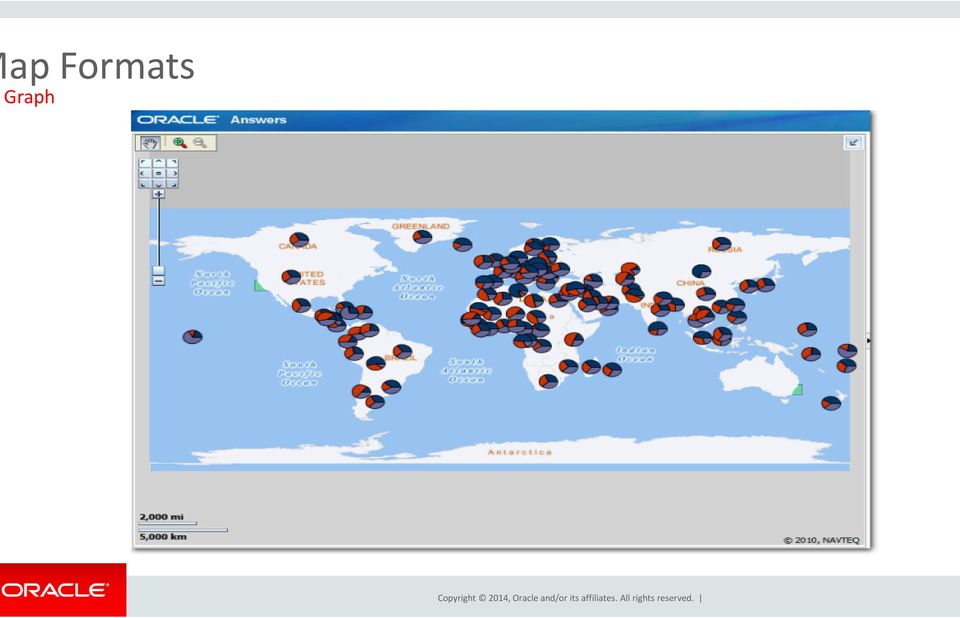
13 ap View Formats Color Fill (choropleth) Percentile, Value, Continuous binning Dashboard user run-time slider Graphs Bar, Pie Adjustable graph size Series by second dimension Bubble (variable sized) Min-Max size specification Color specification Variable Shape Circle, Triangle, Diamond Customizable Image Imported via MapViewer More can be added from MapBuilder Custom Point Layer Uses Lat / Long Does not require a Layer Def


14 ap Formats r

15 ap Formats iable Shape (Bubble)
")
16 ap Formats tom
17 ap Formats age

18 ap Formats r Graph
19 ap Formats Graph
20 Map Interactions Drilling

21 Users can choose which formats are displayed
22 dashboard page can have multiple map views
23 The background map itself can be a thematic map
24 Master-Detail linking: Country at a glance on the map, details for a state in charts
25 ified End User Experience with Oracle Stack plete. Consistent. Accurate. Mobile Scorecards Reports Office Integration Interactive Dashboards Applications & Portals Geospatial Visualization Search Ad-hoc Queries Collaboration
2010 Oracle Corporation 1
 1 Introduction to Geospatial Visualization in Oracle Business Intelligence Enterprise Edition, 11g Product Mgmt., Oracle Business Intelligence and Spatial Agenda Introduction When
BIWA TechCast September 8, 2010
 Information Visualization Using Maps in Oracle Business Intelligence 11g Copyright 2010, Vlamis Software Solutions, Inc. BIWA TechCast September 8, 2010 Dan Vlamis, Vlamis Software Solutions Abhinav Agarwal,
Using Map Views and Spatial Analytics in OBI 11g. BIWA Summit 2014
 Using Map Views and Spatial Analytics in OBI 11g BIWA Summit 2014 Tim Vlamis Dan Vlamis Vlamis Software Solutions 816-781-2880 http://www.vlamis.com Vlamis Software Solutions Vlamis Software founded in
Advanced Dashboard Design in OBI 11g. Collaborate 2013 Session 726
 Advanced Dashboard Design in OBI 11g Collaborate 2013 Session 726 Tim Vlamis Vlamis Software Solutions 816-781-2880 http://www.vlamis.com Vlamis Software Solutions Vlamis Software founded in 1992 in Kansas
OBI 11g Data Visualization Best Practices
 OBI 11g Data Visualization Best Practices Tim Vlamis Vlamis Software Solutions 816-781-2880 http://www.vlamis.com Dan Vlamis Vlamis Software Solutions 816-781-2880 http://www.vlamis.com Copyright 2012,
Data Visualization for Oracle Business Intelligence 11g. Oracle OpenWorld 2014
 Data Visualization for Oracle Business Intelligence 11g Oracle OpenWorld 2014 Tim Vlamis Dan Vlamis Vlamis Software Solutions 816-781-2880 http://www.vlamis.com Session #UGF9227 Copyright 2014, Vlamis
Data Visualization for Oracle Business Intelligence 11g. BIWA Summit 2015
 Data Visualization for Oracle Business Intelligence 11g BIWA Summit 2015 Tim Vlamis Dan Vlamis Vlamis Software Solutions 816-781-2880 http://www.vlamis.com BIWA SIG Started in summer of 2006 BIWA Summits
OBI 11g Data Visualization Best Practices
 OBI 11g Data Visualization Best Practices Heartland Oracle User Group 2012 Tim Vlamis Vlamis Software Solutions 816-781-2880 http://www.vlamis.com Copyright 2012, Vlamis Software Solutions, Inc. Vlamis
OBI 11g Data Visualization Best Practices
 OBI 11g Data Visualization Best Practices Oracle OpenWorld 2012 Tim Vlamis Brian Terry Vlamis Software Solutions 816-781-2880 http://www.vlamis.com Vlamis Software Solutions Founded in 1992 by Dan Vlamis
Overview of Creating Analyses and Dashboards in OBIEE 11g
 Overview of Creating Analyses and Dashboards in OBIEE 11g Venkatakrishnan Srinivasan, Principal Consultant, Rittman Mead AIOUG Sangam Conference, Bangalore December 2011 Introductions Venkatakrishnan Srinivasan
Location Analytics Integrating GIS technologies with SAP Business intelligence,
 Location Analytics Integrating GIS technologies with SAP Business intelligence, Jag Dhillon SAP Analytics Presales Consultant November 2014 Agenda Importance of Location Analytics SAP Location Analytics
Oracle Business Intelligence 11g Business Dashboard Management
 Oracle Business Intelligence 11g Business Dashboard Management Thomas Oestreich Chief EPM STrategist Tool Proliferation is Inefficient and Costly Disconnected Systems; Competing Analytic
1 Copyright 2011, Oracle and/or its affiliates. All rights reserved.
 1 Copyright 2011, Oracle and/or its affiliates. All rights Building Visually Appealing Web 2.0 Data Dashboards Frank Nimphius Senior Principal Product Manager, Oracle 2 Copyright 2011, Oracle and/or its
Maps Change the World of Business Intelligence
 Maps Change the World of Business Intelligence How Executives Visualize Corporate Data with Oracle Business Intelligence 11g NEOOUG September 16, 2011 Dan Vlamis Vlamis Software Solutions 816-781-2880
An Oracle White Paper April 2010. Value of Spatial Analytics in Business Intelligence
 An Oracle White Paper April 2010 Value of Spatial Analytics in Business Intelligence Disclaimer The following is intended to outline our general product direction. It is intended for information purposes
Oracle BI 11g R1: Create Analyses and Dashboards
 Oracle University Contact Us: Local: 1800 103 4775 Intl: +91 80 67863102 Oracle BI 11g R1: Create Analyses and Dashboards Duration: 5 Days What you will learn This Oracle BI 11g R1: Create Analyses and
uncommon thinking ORACLE BUSINESS INTELLIGENCE ENTERPRISE EDITION ONSITE TRAINING OUTLINES
 OBIEE 11G: CREATE ANALYSIS AND DASHBOARDS: 11.1.1.7 DURATION: 4 DAYS Course Description: This course provides step-by-step instructions for creating analyses and dashboards, which compose business intelligence
Intelligent Government From Data to Decision. Robert Lindsley robert.lindsley@oracle.com Oracle, Public Sector Technology Group
 Intelligent Government From Data to Decision Robert Lindsley robert.lindsley@oracle.com Oracle, Public Sector Technology Group Safe Harbor Statement The following is intended to outline our general product
Information visualization examples
 Information visualization examples 350102: GenICT II 37 Information visualization examples 350102: GenICT II 38 Information visualization examples 350102: GenICT II 39 Information visualization examples
P6 Analytics Reference Manual
 P6 Analytics Reference Manual Release 3.2 October 2013 Contents Getting Started... 7 About P6 Analytics... 7 Prerequisites to Use Analytics... 8 About Analyses... 9 About... 9 About Dashboards... 10 Logging
OBIEE 11g : Answers, Dashboards & More
 OBIEE 11g : Answers, Dashboards & More Mark Rittman, Director, Rittman Mead Oracle Open World, San Francisco, September 2010 Introductions Mark Rittman, Co-Founder of Rittman Mead Oracle ACE Director,
Oracle Utilities Mobile Workforce Management Business Intelligence
 Oracle Utilities Mobile Workforce Management Business Intelligence Metric Reference Guide Release 2.4.0 E26818-01 December 2011 Oracle Utilities Mobile Workforce Management Business Intelligence Metric
Oracle Utilities Mobile Workforce Management Business Intelligence
 Oracle Utilities Mobile Workforce Management Business Intelligence Metric Reference Guide Release 2.4.0.4 E35280-03 December 2012 Oracle Utilities Mobile Workforce Management Business Intelligence Metric
Safe Harbor Statement
 Safe Harbor Statement The preceding is intended to outline our general product direction. It is intended for information purposes only, and may not be incorporated into any contract. It is not a commitment
FINANCIAL REPORTING WITH BUSINESS ANALYTICS
 www.ifsworld.com FINANCIAL REPORTING WITH BUSINESS ANALYTICS LEIF JOHANSSON BUSINESS SOLUTIONS CONSULTANT BILL NOBLE IMPLEMENTATION MANAGER 2009 IFS AGENDA FINANCIAL REPORTING WITH BA Architecture Business
How To Choose A Business Intelligence Toolkit
 Background Current Reporting Challenges: Difficulty extracting various levels of data from AgLearn Limited ability to translate data into presentable formats Complex reporting requires the technical staff
Oracle Platform GIS & Location-Based Services. Fred Louis Solution Architect Ohio Valley
 Oracle Platform GIS & Location-Based Services Fred Louis Solution Architect Ohio Valley Overview Geospatial Technology Trends Oracle s Spatial Technologies Oracle10g Locator Spatial Oracle Application
Which Reporting Tool Should I Use for EPM? Glenn Schwartzberg InterRel Consulting info@interrel.com
 Which Reporting Tool Should I Use for EPM? Glenn Schwartzberg InterRel Consulting info@interrel.com Disclaimer These slides represent the work and opinions of the presenter and do not constitute official
ABSS Solutions, Inc. Upper Marlboro, MD 20772
 ABSS Solutions, Inc. Upper Marlboro, MD 20772 1. 1 Using Business Information LogiXML Implementation Process LogiXML Licensing Structure LogiXML Implementations LogiXML Corporate Overview ASI Implementation
More Than a Map: Location Intelligence with SAS Visual Analytics Falko Schulz and Anand Chitale, SAS Institute Inc., Cary, NC
 Paper SAS021-2014 More Than a Map: Location Intelligence with SAS Visual Analytics Falko Schulz and Anand Chitale, SAS Institute Inc., Cary, NC ABSTRACT More organizations are understanding the importance
Data Visualization & Dashboard Design Best Practices and Tips
 Data Visualization & Dashboard Design Best Practices and Tips Understanding the User is the Key to Designing User-Centric Analytical Dashboards User-centric design is Catered specifically to the needs
INTRAFOCUS. DATA VISUALISATION An Intrafocus Guide
 DATA VISUALISATION An Intrafocus Guide September 2011 Table of Contents What is Data Visualisation?... 2 Where is Data Visualisation Used?... 3 The Market View... 4 What Should You Look For?... 5 The Key
From Business Intelligence to Location Intelligence with the Lily Library
 From Business Intelligence to Location Intelligence with the Lily Library Matteo Golfarelli Stefano Rizzi Marco Mantovani Federico Ravaldi Agenda Location Intelligence State of the art Lily Features Architecture
Developing Business Intelligence and Data Visualization Applications with Web Maps
 Developing Business Intelligence and Data Visualization Applications with Web Maps Introduction Business Intelligence (BI) means different things to different organizations and users. BI often refers to
Need for Business Intelligence
 Wisdom InfoTech Need for Business Intelligence INFORMATION AT YOUR FINGER TIPS May 2007 ABRAHAM PABBATHI Principal Consultant BI Practice Wisdom InfoTech 18650 W. Corporate Drive Suite 120 Brookfield WI
OBIEE 11g Pre-Built Dashboards from Oracle Courtesy: Oracle OBIEE 11g Deployment on Vision Demo Data FINANCIALS
 FINANCIALS General Ledger The General Ledger module provides insight into key financial areas of performance, including balance sheet, cash flow, budget vs. actual, working capital, liquidity. Dashboard
Microsoft Dynamics NAV Reporting Options. Derek Lamb May 2010
 Microsoft Dynamics NAV Reporting Options Derek Lamb May 2010 Agenda Positioning of Products Why Business Intelligence? Intergen Offerings Reporting Services Power Pivot ZAP SharePoint 2010 Questions Choosing
MicroStrategy Desktop
 MicroStrategy Desktop Quick Start Guide MicroStrategy Desktop is designed to enable business professionals like you to explore data, simply and without needing direct support from IT. 1 Import data from
Business Intelligence and Healthcare
 Business Intelligence and Healthcare SUTHAN SIVAPATHAM SENIOR SHAREPOINT ARCHITECT Agenda Who we are What is BI? Microsoft s BI Stack Case Study (Healthcare) Who we are Point Alliance is an award-winning
How SAP Business Intelligence Solutions provide real-time insight into your organization
 How SAP Business Intelligence Solutions provide real-time insight into your organization 28 Oct 2015 Agenda 1) What is Business Intelligence (BI) 2) SAP BusinessObjects Features Overview 3) Demo & Report
Keep managers better informed on their areas of responsibility and highlight the issues that require their attention with dashboards!
 Meet Your Targets! Effective Performance Management certainly requires more than just the technology to support it. Expertise in KPI development, target setting, framework modeling, dashboard development
SalesLogix Advanced Analytics
 SalesLogix Advanced Analytics SalesLogix Advanced Analytics Benefits Snapshot Increase organizational and customer intelligence by analyzing data from across your business. Make informed business decisions
The Missing Component in Retail s use of Business Intelligence and Analytics
 White Paper Location Analytics: The Missing Component in Retail s use of Business Intelligence and Analytics Galigeo 87 avenue d Italie 7013 Paris +33 (0) 1 44 06 79 44 www.galigeo.com Contents What is
Maximising value through business insight. Business Intelligence White Paper
 Maximising value through business insight Business Intelligence White Paper October 2015 CONTENTS Reports were tedious. Earlier it would take days for manual collation. Now all this is available at the
Lost in Space? Methodology for a Guided Drill-Through Analysis Out of the Wormhole
 Paper BB-01 Lost in Space? Methodology for a Guided Drill-Through Analysis Out of the Wormhole ABSTRACT Stephen Overton, Overton Technologies, LLC, Raleigh, NC Business information can be consumed many
TABLEAU COURSE CONTENT. Presented By 3S Business Corporation Inc www.3sbc.com Call us at : 281-823-9222 Mail us at : info@3sbc.com
 TABLEAU COURSE CONTENT Presented By 3S Business Corporation Inc www.3sbc.com Call us at : 281-823-9222 Mail us at : info@3sbc.com Introduction and Overview Why Tableau? Why Visualization? Level Setting
IBM Cognos TM1 Executive Viewer Fast self-service analytics
 Data Sheet IBM Cognos TM1 Executive Viewer Fast self-service analytics Overview IBM Cognos TM1 Executive Viewer provides business users with selfservice, real-time, Web-based access to information from
Microsoft Services Exceed your business with Microsoft SharePoint Server 2010
 Microsoft Services Exceed your business with Microsoft SharePoint Server 2010 Business Intelligence Suite Alexandre Mendeiros, SQL Server Premier Field Engineer January 2012 Agenda Microsoft Business Intelligence
ElegantJ BI. White Paper. Achieve a Complete Business Picture with a Business Intelligence (BI) Dashboard
 Dashboard") ElegantJ BI White Paper Achieve a Complete Business Picture with a Business Intelligence (BI) Dashboard Integrated Business Intelligence and Reporting for Performance Management, Operational Business Intelligence
ElegantJ BI White Paper Achieve a Complete Business Picture with a Business Intelligence (BI) Dashboard Integrated Business Intelligence and Reporting for Performance Management, Operational Business Intelligence
Business Intelligence Cloud Service Deliver Agile Analytics
 Business Intelligence Cloud Service Deliver Agile Analytics Copyright 2014 Oracle Corporation. All Rights Reserved. You need a powerful platform for advanced analytics, one that s also intuitive and easy
JD Edwards EnterpriseOne One View Reporting Functional Content Overview
 JD Edwards EnterpriseOne One View Reporting Functional Content Overview October 2012 2 Agenda ERP Reporting Business Issues Benefits of One View Reporting One View Reporting Across The Enterprise Functional
MicroStrategy Analytics Express User Guide
 MicroStrategy Analytics Express User Guide Analyzing Data with MicroStrategy Analytics Express Version: 4.0 Document Number: 09770040 CONTENTS 1. Getting Started with MicroStrategy Analytics Express Introduction...
Understanding and Selecting Geospatial Analytics Tools
 Understanding and Selecting Geospatial Analytics Tools A Practical Example COLLABORATIVE WHITEPAPER SERIES Geospatial Business Intelligence (BI) has been in the conversation related to BI now for quite
B. 3 essay questions. Samples of potential questions are available in part IV. This list is not exhaustive it is just a sample.
 IS482/682 Information for First Test I. What is the structure of the test? A. 20-25 multiple-choice questions. B. 3 essay questions. Samples of potential questions are available in part IV. This list is
Microsoft Business Intelligence Platform
 Microsoft Business Intelligence Platform Agenda Welcome / Introductions Business Intelligence (BI) Overview Microsoft BI Stack Overview SharePoint BI Demo Q & A P 2 Firm Overview Founded in 1997. Offices:
PRONTO-Xi Business Intelligence
 Business Intelligence Copyright 2011 Pronto Software Pty Ltd. All rights reserved. PRONTO Xi Business Intelligence Overview Trademarks - PRONTO, PRONTO ENTERPRISE MANAGEMENT SYSTEM, PRONTO SOFTWARE (Logo)
Dashboard Overview. Bernd Schneider. Technical Solution Professional BI Microsoft Switzerland bernd.schneider@microsoft.com
 Dashboard Overview Bernd Schneider Technical Solution Professional BI Microsoft Switzerland bernd.schneider@microsoft.com Techdays Bern (8./9. April) http://www.techdays.ch + * Including Microsoft Office
Out of the Box Business Intelligence and Reporting in SharePoint 2013
 Out of the Box Business Intelligence and Reporting in SharePoint 2013 Today s Presentation Will Cover: About Gig Werks SharePoint 2013 Overview Demonstration & Discussion Excel Services Power View PowerPivot
Implementing Data Models and Reports with Microsoft SQL Server
 Course 20466C: Implementing Data Models and Reports with Microsoft SQL Server Course Details Course Outline Module 1: Introduction to Business Intelligence and Data Modeling As a SQL Server database professional,
Exclusive access to metrics to measure KPIs in real time, and at scale
 Analytics Exclusive access to metrics to measure KPIs in real time, and at scale Metrics to optimize your campaigns Isolate sources that matter most Advanced filtering Track active and passive customer
Microsoft Business Intelligence Visualization Comparisons by Tool
 Microsoft Business Intelligence Visualization Comparisons by Tool Version 3: 10/29/2012 Purpose: Purpose of this document is to provide a quick reference of visualization options available in each tool.
Understanding and Evaluating the BI Platform by Cindi Howson
 Understanding and Evaluating the BI Platform by Cindi Howson All rights reserved. Reproduction in whole or part prohibited except by written permission. Product and company names mentioned herein may be
WebFOCUS InfoDiscovery
 Information Builders helps organizations transform data into business value. Our business intelligence, integration, and data integrity solutions enable smarter decision-making, strengthen customer relationships,
QAD Business Intelligence
 QAD Business Intelligence QAD Business Intelligence (QAD BI) unifies data from multiple sources across the enterprise and provides a complete solution that enables key enterprise decision makers to access,
Implementing Data Models and Reports with Microsoft SQL Server 20466C; 5 Days
 Lincoln Land Community College Capital City Training Center 130 West Mason Springfield, IL 62702 217-782-7436 www.llcc.edu/cctc Implementing Data Models and Reports with Microsoft SQL Server 20466C; 5
Business Intelligence & Product Analytics
 2010 International Conference Business Intelligence & Product Analytics Rob McAveney www. 300 Brickstone Square Suite 904 Andover, MA 01810 [978] 691 8900 www. Copyright 2010 Aras All Rights Reserved.
<no narration for this slide>
 1 2 The standard narration text is : After completing this lesson, you will be able to: < > SAP Visual Intelligence is our latest innovation
Insights for SharePoint 2013 INTRODUCTION TO THE BI TOOLS
 Insights for SharePoint 2013 INTRODUCTION TO THE BI TOOLS Webinar Topics Intro to BI Tools What is SharePoint? What is Business Intelligence? Evolution of Business Intelligence Common Challenges of BI
Microsoft Dynamics NAV
 Microsoft Dynamics NAV Maximising value through business insight Business Intelligence White Paper October 2015 CONTENTS Reports were tedious. Earlier it would take days for manual collation. Now all this
SAP Manufacturing Intelligence By John Kong 26 June 2015
 SAP Manufacturing Intelligence By John Kong 26 June 2015 Agenda Registration Next Generation of SAP Solution for Manufacturing Tea Break SAP Business Analytics Solutions for Manufacturing - Dashboard Design
Data Visualization Handbook
 SAP Lumira Data Visualization Handbook www.saplumira.com 1 Table of Content 3 Introduction 20 Ranking 4 Know Your Purpose 23 Part-to-Whole 5 Know Your Data 25 Distribution 9 Crafting Your Message 29 Correlation
A Visualization is Worth a Thousand Tables: How IBM Business Analytics Lets Users See Big Data
 White Paper A Visualization is Worth a Thousand Tables: How IBM Business Analytics Lets Users See Big Data Contents Executive Summary....2 Introduction....3 Too much data, not enough information....3 Only
Solution Park Support for Visual Dashboards
 Solution Park Support for Visual Dashboards CS Odessa corp. Contents What is a Dashboard?...4 CS Odessa Role...4 Live Objects Technology...5 Transforming Objects...5 Switching Object...5 Data Driven Objects...6
CRM Dashboard for Square Yards: An Application of Business Analytics
 Business and Management Research Journal Vol. 6(2): 1-11, February 2016 Available online at http://resjournals.com/journals/research-in-business-and-management.html ISSN: 2026-6804 2016 International Research
Business Intelligence Tools Information Session and Survey. December, 2012
 Business Intelligence Tools Information Session and Survey December, 2012 Agenda Introduction to Business Intelligence (BI) Common Business Intelligence Uses in Higher Education UMass: Mobile President
Customer Relationship Management (CRM)
") Customer Relationship Management (CRM) Improve your sales, marketing, and customer service performance with an Integrated CRM System The Integrated Solution Model (ISM) Organizational Benefits of Customer
Customer Relationship Management (CRM) Improve your sales, marketing, and customer service performance with an Integrated CRM System The Integrated Solution Model (ISM) Organizational Benefits of Customer
QAD Enterprise Asset Management BI Metrics Demonstration Guide. May 2015 BI 3.11
 QAD Enterprise Asset Management BI Metrics Demonstration Guide May 2015 BI 3.11 Overview This demonstration focuses on one aspect of QAD Enterprise Asset Management Business Intelligence Metrics and shows
Microsoft 20466 - Implementing Data Models and Reports with Microsoft SQL Server
 1800 ULEARN (853 276) www.ddls.com.au Microsoft 20466 - Implementing Data Models and Reports with Microsoft SQL Server Length 5 days Price $4070.00 (inc GST) Version C Overview The focus of this five-day
Enterprise Data Visualization and BI Dashboard
 Strengths Key Features and Benefits Ad-hoc Visualization and Data Discovery Prototyping Mockups Dashboards The application is web based and can be installed on any windows or linux server. There is no
Data Doesn t Communicate Itself Using Visualization to Tell Better Stories
 SAP Brief Analytics SAP Lumira Objectives Data Doesn t Communicate Itself Using Visualization to Tell Better Stories Tap into your data big and small Tap into your data big and small In today s fast-paced
IBM Cognos Express. Breakthrough BI and planning for midsize companies. Overview
 IBM Cognos Express Breakthrough BI and planning for midsize companies Overview IBM Cognos Express is the first and only integrated business intelligence (BI) and planning solution purpose-built to meet
Tableau Your Data! Wiley. with Tableau Software. the InterWorks Bl Team. Fast and Easy Visual Analysis. Daniel G. Murray and
 Tableau Your Data! Fast and Easy Visual Analysis with Tableau Software Daniel G. Murray and the InterWorks Bl Team Wiley Contents Foreword xix Introduction xxi Part I Desktop 1 1 Creating Visual Analytics
CRM Analytics. SAP enhancement package 1 for SAP CRM 7.0. Gert Tackaert
 CRM Analytics SAP enhancement package 1 for SAP CRM 7.0 Gert Tackaert Agenda 1. CRM Analytics the right tool for the right user experience SAP BusinessObjects integration in CRM 2. SAP CRM Interactive
2.0 COMMON FORMS OF DATA VISUALIZATION
 The Importance of Data Visualization to Business Decision Making by Rebeckah Blewett, Product Manager, Dundas Data Visualization, Inc.Sunday, June 12, 2011 1.0 INTRODUCTION Informed decision making is
ReportPortal Web Reporting for Microsoft SQL Server Analysis Services
 Zero-footprint OLAP OLAP Web Client Web Client Solution Solution for Microsoft for Microsoft SQL Server Analysis Services ReportPortal Web Reporting for Microsoft SQL Server Analysis Services See what
Oracle Business Intelligence EE. Prab h akar A lu ri
 Oracle Business Intelligence EE Prab h akar A lu ri Agenda 1.Overview 2.Components 3.Oracle Business Intelligence Server 4.Oracle Business Intelligence Dashboards 5.Oracle Business Intelligence Answers
WHAT S NEW IN OBIEE 11.1.1.7
 Enterprise Data Management OBI Author Training, March 2015 WHAT S NEW IN OBIEE 11.1.1.7 NEW PRESENTATION FEATURES VIEWS 1) Recommended Visualizations Feature When you create a new view, OBIEE looks at
QPR Quality Management
 QPR Quality Management Solution Overview QPR Balanced Scorecard Solution - Overview Your organization s success with Balanced Scorecard certainly depends on more than just the technology to support it.
ProClarity Analytics Family
 ProClarity Analytics Platform 6 Product Data Sheet Accelerated understanding The ProClarity Analytics family enables organizations to centrally manage, store and deploy best practices and key performance
location says it all AGENDRA KUMAR technology IS PRESIDENT OF ESRI INDIA. The Smart Manager Nov-Dec 2015 www.thesmartmanager.
 technology AGENDRA KUMAR IS PRESIDENT OF ESRI INDIA. location says it all illustration by nilesh juvalekar The location analytics market is expected to grow from USD 7.2 Billion in 2015 to USD 14.2 Billion
SAP Dashboard. Mohammed Wahaj
 SAP Dashboard Mohammed Wahaj Interactive analytics is an analytic capability and Dashboard is an information delivery capability. Gatner SAP Dashboard is one of the products which is offered under the
How To Understand The Financial Crisis
 White Paper September 2009 Top ten reports every insurance executive needs Executive insight with IBM Cognos software 2 Contents 5 The top 10 reports 5 The Production, Underwriting and Claims Overview
P6 Analytics Sample Dashboards Reference Manual
 P6 Analytics Sample Dashboards Reference Manual January 2013 Legal Notices Oracle Primavera P6 Analytics Sample Dashboards Reference Manual Copyright 1997, 2013, Oracle and/or its affiliates. All rights
Gain insight, agility and advantage by analyzing change across time and space.
 White paper Location Intelligence Gain insight, agility and advantage by analyzing change across time and space. Spatio-temporal information analysis is a Big Data challenge. The visualization and decision
White Paper May 2009. Seven reports every supply chain executive needs Supply Chain Performance Management with IBM
 White Paper May 2009 Seven reports every supply chain executive needs Supply Chain Performance Management with IBM 2 Contents 3 Business problems 3 Business drivers 4 The solution IBM Cognos SCPM Seven
Business Intelligence in Excel 2013 Excel, PowerPivot and Power View. Stéphane Fréchette Friday April 26, 2013
 Business Intelligence in Excel 2013 Excel, PowerPivot and Power View Stéphane Fréchette Friday April 26, 2013 Who am I? My name is Stéphane Fréchette I m a Database & Business Intelligence Professional
Technology Supporting Performance and Quality Leadership
 Technology Supporting Performance and Quality Leadership Prepared for: PMIWDC and FAA Program Office Presented by: John Mullins - Director Strategy and People mullins.john@serco-na.com 703-234-6459 Chuck
Integrating GIS within the Enterprise Options, Considerations and Experiences
 Integrating GIS within the Enterprise Options, Considerations and Experiences Enterprise GIS Track Enrique Yaptenco Carsten Piepel Bruce Rowland Mark Causley Agenda Business Drivers and Requirements Key
Ignite Your Creative Ideas with Fast and Engaging Data Discovery
 SAP Brief SAP BusinessObjects BI s SAP Crystal s SAP Lumira Objectives Ignite Your Creative Ideas with Fast and Engaging Data Discovery Tap into your data big and small Tap into your data big and small
ENTERPRISE REPORTING AND ANALYTICS FOUNDATION. A Complete Business Intelligence Solution
 ENTERPRISE REPORTING AND ANALYTICS FOUNDATION A Complete Business Intelligence Solution INCREASE PROFITABILITY WITH A COMPLETE BUSINESS INTELLIGENCE SOLUTION The increased competition faced by today s