Back to Work: Re-employment, Earnings and Skill Use after Job Displacement
|
|
|
- Roland McKinney
- 8 years ago
- Views:
Transcription
1 FINAL REPORT Back to Work: Re-employment, Earnings and Skill Use after Job Displacement VS/211/32 SI (DI11934): Helping Displaced Workers Back into Jobs by Maintaining and Upgrading their Skills October 213 Glenda Quintini and Danielle Venn Employment Analysis and Policy Division Directorate for Employment, Labour and Social Affairs
 Employment Analysis and Policy Division www.oecd.")
2

3 FOREWORD 3 FOREWORD This report provides new and more extensive evidence about the incidence of job displacement and its consequences for 14 countries. Job displacement is defined as involuntary job loss due to economic factors such as economic downturns or structural change and particular efforts are made to improve data comparability across the 14 countries included in the analysis. Displacement rates as well as re-employment rates one or/and two years after displacement are presented in the chapter. The report also looks at the effect of displacement on subsequent earnings, as well as some additional aspects of job quality, and explores changes in skill requirements resulting from occupational mobility following displacement. Finally, the groups of workers most affected by displacement both in terms of its incidence and consequences are identified. The OECD gratefully acknowledges financial support by the European Commission both for the production of the report and for the organisation of the conference at which it was discussed. This report was prepared by Glenda Quintini and Danielle Venn. Statistical assistance was provided by Sylvie Cimper, Paulina Granados Zambrano and Vahé Nafilyan. A preliminary version of this report was presented to an expert audience at a conference held in Paris on May 213 and this final version incorporates the feedback collected at the event. The analysis carried out in the report serves as background to a series of country-specific studies that the OECD will carry out over the next two years. Participating countries include: Australia, Canada, Denmark, Finland, Japan, Korea, New Zealand, Sweden and the United States. BACK TO WORK: RE-EMPLOYMENT, EARNINGS AND SKILL USE AFTER JOB DISPLACEMENT OECD 213

4

5 TABLE OF CONTENTS TABLE OF CONTENTS Acronyms and abbreviations... 7 Back to work: Re-employment, earnings and skill-use after job displacement... 9 Executive summary... 9 Introduction Defining and measuring job displacement How large is the risk of job displacement and who is affected? Getting back to work after job displacement Earnings, hours and working arrangements after displacement The consequences of job displacement for skill use Conclusions Notes... 4 References Annex A1. Data sources and definitions... 3 Annex A2. Review of literature... 6 Boxes Box 1. Measuring the true value of earnings losses after displacement... 2 Box 2. Broader measures of job quality after displacement Box 3. Measuring skills used at work... 3 Figures Figure 1. Displacement rates, Figure 2. Historical displacement rates Figure 3. Trends in displacement rates, Figure 4. Relative displacement rates by personal and job characteristics, Figure. Variation in displacement rates by region, industry and occupation, Figure 6. Re-employment after displacement Figure 7. Relative re-employment rates by characteristics Figure 8. Re-employment rates by region, Figure 9. Labour force status of displaced workers after displacement, average Figure 1. Earnings changes before and after displacement Figure 11. Monthly earnings and wage changes before and after displacement Figure 12. Earnings changes before and after displacement by gender Figure 13. Earnings changes before and after displacement by age Figure 14. Earnings changes before and after displacement by education level... 3 Figure 1. Change in working hours, job security and form of employment after displacement Figure 16. Skill use before displacement, BACK TO WORK: RE-EMPLOYMENT, EARNINGS AND SKILL USE AFTER JOB DISPLACEMENT OECD 213

6 6 TABLE OF CONTENTS Figure 17. Changes in occupation and skills set after displacement, Figure 18. Incidence of professional upgrading and downgrading following displacement, Figure 19. Human capital loss following displacement, Figure 2. Skill switches, by nature of the switch and socio-demographic characteristics, Figure 21. Earnings changes before and after displacement by skill-switch and industry-move status Tables Table 1. Factors affecting displacement risk, average Table 2. Percentage of non-working displaced workers who are not in the labour force within one year of displacement, by characteristics, average Table A1.1. Data sources and definitions... 4 Table A2.1. Review of literature... 7 BACK TO WORK: RE-EMPLOYMENT, EARNINGS AND SKILL USE AFTER JOB DISPLACEMENT OECD 213

7 ACRONYMS AND ABBREVIATIONS 7 ACRONYMS AND ABBREVIATIONS ISCO O*NET International Standard Classification of Occupations Occupational Information Network (United States) BACK TO WORK: RE-EMPLOYMENT, EARNINGS AND SKILL USE AFTER JOB DISPLACEMENT OECD 213

8

9 FINAL REPORT 9 BACK TO WORK: RE-EMPLOYMENT, EARNINGS AND SKILL-USE AFTER JOB DISPLACEMENT Executive summary This report provides new and more extensive evidence of job displacement and its consequences for 14 countries. Job displacement, i.e. involuntary job loss due to economic factors such as economic downturns or structural change, is highly cyclical but has not exhibited any upwards trend over the past decade. Differences in available data sources and definitions make cross-country comparisons difficult, but it appears that displacement affects around 2-7 of employees every year in the countries for which data are available. Some workers have a greater risk of job displacement and are more likely to experience poor postdisplacement outcomes than others. In most of the countries examined, older workers and those with low education levels have a higher displacement risk, take longer to get back into work and suffer greater (and more persistent) earnings losses. While youth also have a higher risk of displacement than prime-aged workers, they fare better afterwards. Young workers generally find work relatively quickly after displacement, often in jobs with greater skill requirements than their previous jobs. Women are generally no more likely to be displaced than men, once other factors such as the type of contract they hold before displacement are taken into account. However, women are more likely than men to become disconnected from the labour market and experience longer spells of inactivity after displacement. The extent of earnings losses after displacement varies substantially across countries. Earnings losses tend to be fairly low in the Nordic countries, but much larger in the other countries examined in the report. Most of the loss in annual earnings after displacement can be attributed to time spent out of work rather than to lower wage rates upon re-employment. In most of the countries examined, men suffered from bigger and more persistent earnings losses than women, despite women taking longer, on average, to return to work. Older workers and those who did not complete secondary school also tend to suffer greater-than-average earnings losses after displacement. As well as lower earnings, re-employed displaced workers are more likely to work in part-time or non-permanent jobs than prior to displacement, and work shorter hours on average. Other measures of the quality of post-displacement jobs, such as the incidence of work at non-standard times, the availability of paid leave and whether workers have managerial responsibilities, also suggest a decline in job quality after displacement. Some of this effect may be due to the loss of seniority that displacement brings, as job quality tends to improve with longer tenure. Displaced workers tend to use fewer mathematics, cognitive, interpersonal and verbal skills and more craft and physical skills in their pre-displacement jobs than the average employee. This suggests that they may be ill-equipped to take advantage of job opportunities in expanding sectors after displacement. Nevertheless, most displaced workers who are re-employed find jobs that use similar skills to their pre-displacement jobs, even if they move to a new occupation or industry. Even among those who experience a significant change in skill use following displacement, many move to jobs with higher skill requirements than their former jobs. However, a small sub-set of workers experience professional downgrading, where their new jobs use far fewer skills than their previous jobs. Those who suffer BACK TO WORK: RE-EMPLOYMENT, EARNINGS AND SKILL USE AFTER JOB DISPLACEMENT OECD 213

10 1 FINAL REPORT professional downgrading experience significant losses in math, verbal, cognitive and interpersonal skills, modest gains in the use of craft skills and significant increases in the use of physical skills. Changes in skill use after displacement explain some, but not all, of the earnings losses experienced by displaced workers. Changes in industry also appear to matter, suggesting that the loss of job-specific skills plays a role alongside changes in the use of generic skills. These findings help identify a number of policy issues to be explored in future work. First, are policies that require large firms to provide re-employment services to displaced workers justified? On the one hand, this report shows that workers in smaller firms have a much higher risk of displacement than those in larger firm, suggesting that general active labour market programmes are needed. On the other hand, while displacement is more likely in smaller firms, the number of displaced workers is generally larger in larger firms, possibly justifying existing obligations applying to the latter. Second, what type of re-employment assistance and training is best suited to help displaced workers find work? findings in this report suggest that not all displaced workers may need retraining to find a new, high-quality job as not all changes in industry or occupation after displacement lead to a significant change in the skills used at work. However, a small group of displaced workers moves to job with significantly lower skill requirements, leading to professional downgrading and more sizeable earnings losses, pointing to the need both for skills assessment at unemployment entry and either retraining or job-search support to improve the match between skills and job requirements. Third, should helping people return to work quickly, especially for women, older workers and the low skilled, be a priority to limit earnings losses and skill depreciation after displacement? The finding, in this report, that earnings losses are almost entirely due to periods of non-employment rather than lower wages appears to support this view, expect perhaps for the minority of workers requiring retraining. Finally, does knowing in advance about displacement make a difference in outcomes relative to not knowing? This issue is not explored in this report but should be the object of future analysis, notably by looking at countries such as the United States, with its WARN Act (Worker Adjustment and Retraining Notification Act) which require advance notification to workers affected by economic dismissals. Introduction As documented in recent editions of the OECD Employment Outlook, the so-called Great Recession resulted in the destruction of millions of jobs across OECD countries, as firms closed or downsized. Workers displaced involuntarily from these jobs have often faced long periods of unemployment, during which time their skills could have depreciated. Even when they find a new job, it may have lower pay or inferior working arrangements to their pre-displacement job. As such, the costs of job displacement may be substantial and long-lasting. While job displacement is more prevalent during a downturn, it remains significant even in good times as firms continuously adjust to structural and technological changes. Therefore, it is important to have a better understanding of the incidence and impact of job displacement in order to guide policy for helping affected workers. While the issue of job displacement, and particularly its impact on wages and earnings, is well-documented in the academic literature, differences in the definitions, methods and data sources used make it difficult to compare results across countries and individual studies. As well, a number of key areas of research have been largely neglected in the existing literature, including the impact of displacement on skill use and working arrangements such as hours, job security and job benefits. This report summarises the results of a cross-country study of job displacement over the past decade, covering Australia, Canada, Denmark, Finland, France, Germany, Japan, Korea, New Zealand, BACK TO WORK: RE-EMPLOYMENT, EARNINGS AND SKILL USE AFTER JOB DISPLACEMENT OECD 213

11 FINAL REPORT 11 Portugal, the Russian Federation, Sweden, the United Kingdom and the United States. It attempts to fill some of the gaps in the existing literature by using a comparable methodology to examine job displacement and its consequences in these countries. 1 The report is organised as follows. Section 1 discusses the definitions and data sources used in the report, as well as their limitations. Section 2 presents estimates of the incidence of job displacement as well as identifies the types of workers most likely to be affected. Section 3 discusses the re-employment prospects of displaced workers. Section 4 examines the impact of job displacement on earnings, hours and working arrangements. Section presents a detailed examination of skill-use by displaced workers before and after displacement, and the links between skills and post-displacement wage losses. The implications of the findings for policy makers are discussed in the conclusions of the report. 1. Defining and measuring job displacement In this report, the term job displacement refers to involuntary job separations due to economic or technological reasons or as a result of structural change. Ideally, the exact reason for each job separation would be observed so that job displacements could be distinguished from other forms of job separation such as voluntary quits. However, in practice, it is often very difficult to know or accurately measure the true reason for job separations. In this report, two main types of data source and definitions are used: Firm-identified displacement: job displacements are defined as job separations from firms 2 that, from one year to the next, experience an absolute reduction in employment of five employees or more and a relative reduction in employment of 3 or more (mass dismissal) or that ceased to operate (firm closure). 3 Mass dismissals and firm closures are typically identified using linked employer-employee longitudinal data, usually from administrative sources such as tax or social security records. Self-defined displacement: job displacements are defined as job separations where the reason given for leaving the previous job is economic reasons (e.g. redundancy, layoff, business slowdown, lack of work, firm closure, mass dismissal, etc.) or dismissal for cause (e.g. the worker was not able to do the job, employment terminated during the probation period, poor performance or behaviour of the worker, etc.). 4 Self-defined dismissal is typically measured using household panel data or cross-sectional data with retrospective questions about job displacement. In both cases, workers who separate from their jobs are asked about the reason that they left their job, allowing job displacements to be distinguished from other types of separations. Each definition and data source has its advantages and disadvantages. Firm-identified displacement is commonly used in the literature examining the impact of job displacement on wages and earnings because a mass dismissal or firm closure can be thought of as exogenous to the skills or earning capacity of the workers involved and the large sample sizes usually involved allow for accurate estimation of post-displacement effects. However, individual or small-scale job displacements cannot be easily identified and are excluded from the analysis, even though they may have important consequences for the individuals concerned. Administrative data sources tend to yield more accurate measures of post-displacement wages and earnings than household surveys and contain more information about firm characteristics. However, administrative data sources typically have limited information on worker characteristics and can only distinguish between employment and non-employment after displacement, rather than identifying periods of job-search, education/training or inactivity. By contrast, household surveys usually have a rich array of information about the characteristics of workers and their situation after displacement, but have a smaller sample size than administrative sources. Perhaps the biggest limitation of survey data is in the identification of displacement, which relies on the accuracy of respondents answers to questions about why they left their previous job. Their BACK TO WORK: RE-EMPLOYMENT, EARNINGS AND SKILL USE AFTER JOB DISPLACEMENT OECD 213

12 12 FINAL REPORT answers may be influenced by their experiences after displacement. For example, if they quickly found a new job, they may say that the reason they left their previous job was to move to a better job, in which case the separation would not be identified as a displacement. This would also tend to bias the results towards poorer post-displacement outcomes, as those who report being displaced are likely to be those that stay unemployed longer or experience greater earnings losses. The categorisation of reasons for displacement also varies considerably across the countries examined, making cross-country comparisons more difficult. For example, the treatment of separations from temporary contracts is not the same in each country. In some countries, the end of a temporary contract is one possible reason for leaving the previous job, and workers who leave a temporary contract voluntarily cannot be distinguished from those who do not have their contract renewed for economic reasons. In many countries, workers on temporary contracts often answer that the reason they left their previous job was due to economic reasons, rather than because their temporary contract ended. However in several countries, notably France, a majority of separations of temporary workers are attributed to the end of the contract, rather than economic reasons. For simplicity, the end of a temporary contract is not considered as job displacement in the remainder of this report because it is difficult to accurately identify voluntary and involuntary separations in a way that is consistent across countries. It is not clear, a priori, which of the data sources or definitions used yields the most accurate estimates of displacement. On the one hand, using administrative data excludes displacement in smaller businesses, whose workers are more likely to be displaced and who tend to have certain characteristics, as well as individual or small-scale displacements. On the other, while using survey data potentially covers a broader array of displacements, the results rely on subjective responses and involuntary displacements of temporary workers are not captured in a way that is comparable across countries. In a direct comparison of the two main types of data used in the literature, von Wachter et al. (29a) use matched survey and administrative data for California for the period They find that administrative data tend to overstate the incidence of displacement (by including many voluntary job separations) while survey data tend to understate the incidence of displacement because workers tend to ignore less severe job displacements (those which lead to only short spells of unemployment or small earnings losses) when asked about their recent experiences. These limitations should be kept in mind when comparing displacement incidence and outcomes across countries, particularly when comparing estimates for self-defined and firm-identified displacement. For this reason, these are shown separately in all the figures and tables in this report. Regardless of the data source and definition used, the data are analysed in the form of annual observations. Workers are defined as displaced if they are employed in one year, and either employed in a different job or not employed in the following year and the reason for the separation is either firm-identified or self-defined displacement, as outlined above. The use of annual data will tend to underestimate the incidence of displacement because workers may be displaced several times over the course of a year. Several additional restrictions are placed on the samples used in the analysis. Only employees are examined i.e. employers, the self-employed or unpaid family workers are excluded from the sample. To avoid picking up job separations that happen soon after hiring (and may be the result of the firm and employee deciding that they were not well-matched, rather than for economic reasons), only workers with at least one year of tenure with the same employer are examined. Those who work in public administration, defence, for private households or international organisations are also excluded from the analysis, as are those who hold more than one job prior to displacement. For countries which use the firm-identified definition of displacement, the analysis only covers workers from firms with 1 or more employees in the year prior to displacement. Finally, the analysis examines only workers who were aged 2-64 years in the year prior to displacement. Young workers were excluded for the same reason as BACK TO WORK: RE-EMPLOYMENT, EARNINGS AND SKILL USE AFTER JOB DISPLACEMENT OECD 213

13 J P N Z F R S W C A R U A U K O U S G B D E D N P R F I FINAL REPORT 13 short-tenure workers. Older workers were excluded because it may be difficult to differentiate between displacement and retirement for those aged 6 years and over. Unfortunately, due to data limitations, not all sample restrictions could be implemented for every country. These differences should also be kept in mind when comparing results across countries. A full description of the data sources, definitions and sample restrictions used for each country examined in this report is shown in Annex A1. 2. How large is the risk of job displacement and who is affected? Incidence of job displacement Figure 1 shows the risk of displacement in each country for the periods 2-8 and 29-1, where available. These periods were chosen to provide an indication of differences in displacement and its outcomes before and during the Great Recession. 6 Displacement rates are expressed as the number of employees aged 2-64 who are displaced from one year to the next as a proportion of all employees aged There are considerable differences in displacement rates across countries and between the pre- and post-crisis periods. The effect of the Great Recession is clear, with higher displacement rates in all countries (except the United Kingdom) in 29-1 than in previous years. Nevertheless, displacement rates are relatively low in all the countries examined, with displacement affecting between 1. and 7 of employees each year during the 2s. 7 Despite displacement only affecting a relatively small proportion of employees each year, displaced workers have quite different characteristics to other employees, which may impede their ability to find work quickly after displacement and justify greater policy intervention to prevent long spells of unemployment or inactivity. Figure 1. Displacement rates, 2-1 a Percentage of employees aged 2-64 who are displaced from one year to the next, averages f Self-defined displacement Firm-identified displacement JPN NZL FRA CAN RUS AUS KOR DEU SWE DNK PRT FIN USA GBR Self-defined displacement Firm-identified displacement a) See Annex A1 for a full description of the samples, years and definitions used for each country. Source: Compiled by the OECD Secretariat using data sources described in Annex A1. As seen in the most recent economic downturn, job displacement is highly cyclical in most countries examined. A surge in displacement rates was also seen in previous recessions in the early 198s and early 199s in the few countries for which long time-series on displacement rates are available (Figure 2). BACK TO WORK: RE-EMPLOYMENT, EARNINGS AND SKILL USE AFTER JOB DISPLACEMENT OECD 213

14 14 FINAL REPORT Figure 2. Historical displacement rates a Difference with respect to the country average displacement rate b 3 Spikes in displacement rates Denmark Finland Germany Portugal Sweden a) See Annex A1 for a full description of the samples, years and definitions used for each country. b) Displacement rates are calculated as the percentage of employees aged 2-64 who are displaced from one year to the next. Source: Compiled by the OECD Secretariat using data sources described in Annex A1. Outside these cyclical movements, however, there does not appear to have been any clear trend in the incidence of displacement over the past few decades in the countries examined in this report (Figure 3). The extent to which cross-country differences in displacement rates reflect structural differences in labour market policies and institutions is unclear from this descriptive analysis. Despite the efforts made to ensure that consistent definitions and methods were used for every country, there remains some doubt about the cross-country comparability of estimates of displacement rates due to the issues discussed in Section 1. This should be kept in mind when interpreting the results presented in Figure 1 and in the remainder of the report. BACK TO WORK: RE-EMPLOYMENT, EARNINGS AND SKILL USE AFTER JOB DISPLACEMENT OECD 213
 Displacement rates are calculated as the percentage of employees aged 2-64 who are displaced from one year to the next.")
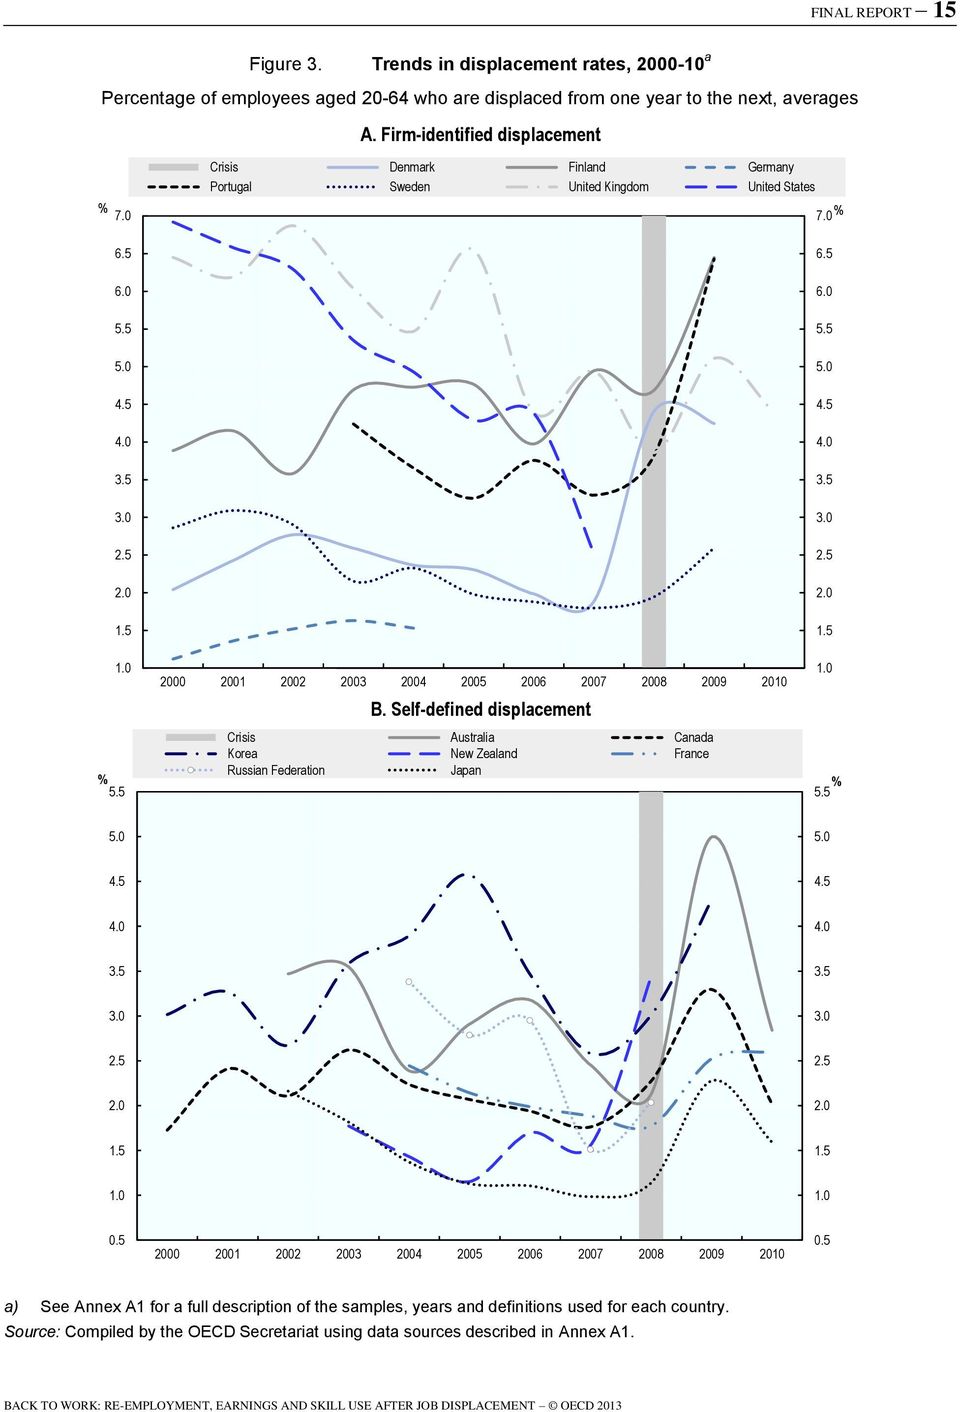
15 FINAL REPORT 1 Figure 3. Trends in displacement rates, 2-1 a Percentage of employees aged 2-64 who are displaced from one year to the next, averages A. Firm-identified displacement Crisis Denmark Finland Germany Portugal Sweden United Kingdom United States B. Self-defined displacement Crisis Australia Canada Korea New Zealand France Russian Federation Japan a) See Annex A1 for a full description of the samples, years and definitions used for each country. Source: Compiled by the OECD Secretariat using data sources described in Annex A1. BACK TO WORK: RE-EMPLOYMENT, EARNINGS AND SKILL USE AFTER JOB DISPLACEMENT OECD 213
16 16 FINAL REPORT Which workers have the highest risk of job displacement? Figure 4 shows the relative incidence of job displacement by selected demographic and job characteristics. Displacement rates for men are, on average, higher than for women in most countries. The exceptions are Korea, Russian Federation, Japan and Finland, where women are more likely to be displaced than men, and Denmark and Portugal, where there is little difference. However, the gender gap in displacement rates may be driven by differences in the types of jobs that men and women hold, rather than any underlying discrimination against men when it comes to dismissal. Table 1 shows that when other factors, including industry and occupation, are controlled for, men are not more significantly likely to be displaced than women except in Germany and Sweden. Indeed, in several countries, women are actually significantly more likely to be displaced than men. However, with the exception of Portugal, these positive effects are found in countries where it is not possible to control for contract type, suggesting that that women s increased risk of displacement may be due, in part, to their higher likelihood of having a non-permanent contract. Displacement rates tend to be highest for the youngest and oldest workers. Figure 4 shows that in the Nordic countries, the United Kingdom, the Russian Federation, Germany and Australia, workers aged 2-24 years face displacement rates for the period 2-8 approximately 2-7 higher than those for prime-aged workers, with the gap growing during the Great Recession in most of the countries for which data are available. These effects remain after controlling for other job and worker characteristics in Germany, Denmark, Finland and Sweden, although young workers are significantly less likely to be displaced than prime-aged workers in Portugal and the United States (Table 1). 8 Older workers (aged -64 years) also have a higher incidence of displacement than prime-aged workers in Australia, France, Japan, Korea, the Russian Federation, Germany and the United Kingdom (Figure 4). Indeed, after controlling for other factors, older workers have a significantly higher risk of displacement than prime-aged workers in all the countries for which data are available except Korea, New Zealand, the Russian Federation and Sweden (Table 1). One of the reasons that this effect is less evident in the raw displacement rates in Figure 4 is that older workers have longer average tenure in their jobs, and long tenure protects workers against displacement (see below). Workers with less than secondary education are more likely to be displaced than those with post-secondary qualifications in many countries (Figure 4). This effect was more pronounced during the Great Recession, coinciding with other evidence that the low-skilled were more adversely affected (e.g. OECD, 21), and with previous work on displacement that found a higher risk of displacement for low-skilled workers (Borland et al., 22). However, this effect disappears in some countries once other factors are controlled for. The clearest cross-country trends in displacement probability relate to job tenure and firm size. Workers with 1-4 years of job tenure are approximately 1. to 3 times more likely to be displaced than those with 1-19 years of tenure. This is consistent with previous studies which find that long tenure protects workers against displacement (e.g. Albaek et al., 22). The risk of job displacement decreases with firm size in all countries examined except the Russian Federation, so that workers in firms with 1-49 workers are 2-6 times more likely to be displaced than those in firms with or more workers. This holds for both firm-identified and self-defined displacement, so cannot be attributable solely to the definition of mass dismissal used for firm-identified displacement. The impact of job tenure and firm size on displacement risk is statistically significant even after controlling for other personal, firm and job characteristics in most of the countries for which data are available (Table 1). BACK TO WORK: RE-EMPLOYMENT, EARNINGS AND SKILL USE AFTER JOB DISPLACEMENT OECD 213

17 AUS CAN FRA KOR NZL RUS DNK FIN DEU PRT GBR AUS CAN FRA JPN KOR RUS DNK FIN DEU PRT SWE GBR AUS CAN FRA JPN KOR NZL RUS DNK FIN DEU PRT SWE GBR USA AUS CAN FRA KOR NZL RUS DNK FIN DEU PRT SWE AUS CAN FRA JPN KOR NZL RUS DNK FIN DEU PRT SWE GBR USA AUS CAN FRA JPN KOR NZL RUS DNK FIN DEU PRT SWE GBR USA G B R FINAL REPORT 17 Figure 4. Relative displacement rates by personal and job characteristics, 2-1 a Ratios of the displacement rate for each specified group to that of the comparison group, 2-8 and 29-1 averages USA A. Men (vs. women) B years (vs years) Self-defined displacement Firm-identified displacement Self-defined displacement Firm-identified displacement C. -64 years (vs years) D. Less than secondary education (vs. post-secondary education) Self-defined displacement Firm-identified displacement Self-defined displacement Firm-identified displacement E. Tenure 1-4 years (vs years) F. Firm size 1-49 employees (vs. + employees) Self-defined displacement Firm-identified displacement Self-defined displacement Firm-identified displacement Note: Logarithmic scales. a) Each panel shows the ratio of the displacement rate for each specified group to that of the comparison group. See Annex A1 for a full description of the samples, years and definitions used for each country. No data on displacement rates by education for Japan or the United States. The firm-size categories are as shown except: the category 1-49 employees refers to less than 2 employees for Australia and Canada, 1-29 employees for Japan and 21- employees for the Russian Federation; and the category + employees refers to 1 + employees for Canada. Source: Compiled by the OECD Secretariat using data sources described in Annex A1. BACK TO WORK: RE-EMPLOYMENT, EARNINGS AND SKILL USE AFTER JOB DISPLACEMENT OECD 213
 B. 2-24 years (vs. 3-44 years) 2. 2. 4. 4. 2. 2. 1. 1. 1. 1..... Self-defined displacement Firm-identified displacement Self-defined displacement Firm-identified displacement C.")
18 18 FINAL REPORT Table 1. Factors affecting displacement risk, average 2-1 Results of regression analysis holding all other factors constant Australia Canada Denmark Finland France Germany Women (vs. men) n.s. n.s. + + n.s years (vs years) n.s. n.s. + + n.s years (vs years) Education level n.s. n.s Firm size Job tenure Non-permanent contract (vs. permanent) Public sector (vs. private sector) Korea New Zealand Portugal Russian Federation Sweden United States a Women (vs. men) n.s. n.s. + n.s years (vs years) n.s. n.s. - n.s years (vs years) - n.s. + n.s. - + Education level - n.s Firm size n.s. - - Job tenure Non-permanent contract (vs. permanent) n.s Public sector (vs. private sector) Note: The regressions include controls for industry, occupation, region and year. +/-: Indicates that effect is positive/negative and significantly different from zero at 9 confidence level or higher. n.s.: Indicates that effect is not significantly different from zero at 9 confidence level or higher...: Indicates that the variable was not included in the regression because data were not available. No comparable data available for Japan. See Annex A1 for a full description of the samples, years and definitions used for each country. a) US results are based on firm-identified displacement from the Longitudinal Employer Household Dynamics (LEHD) Database. Source: Compiled by the OECD Secretariat using data sources described in Annex A1. Having a non-permanent contract significantly increases the risk of displacement, other things equal, in the few countries for which data are available except Korea (Table 1). Workers in the public sector are significantly less likely to be displaced than those in the private sector, which may reflect the greater difficulty of making dismissals in the public sector in many OECD countries, as well as the nature of work in the sector and its relative lack of exposure to market forces. Finally, Figures shows additional breakdowns of displacement rates by region, industry and occupation. Across regions, the largest dispersion is observed in Korea and Portugal but it is also fairly high in Australia, Finland and the United Kingdom. On the other hand, territorial differences appear to be much smaller in Denmark, Russia and Japan. The industries most affected by displacement vary across countries. However, workers in construction and manufacturing tend to be more affected than average in most countries. As far as occupations are concerned, craft workers and machine operators are significantly more likely to be displaced than managers. On the other hand, mid-level professionals notably, associate professionals, technicians and clerks are less likely to be displaced than managers in a majority of countries, with the most notable exception of Japan. This latest finding is interesting as it appears to suggest that the top occupational group is not necessarily faring the best as far as displacement is concerned. However, this result may be due to compositional effects and/or to the fact that the managers category may include self-employed individuals running small family businesses or SMEs at high risk of failure. BACK TO WORK: RE-EMPLOYMENT, EARNINGS AND SKILL USE AFTER JOB DISPLACEMENT OECD 213
 n.s. n.s. - n.s. + - -64 years (vs. 3-44 years) - n.s. + n.s. - + Education level - n.s. - + +.. Firm size -.. + n.s. - - Job tenure - - - -.")
19 FINAL REPORT 19 Figure. Variation in displacement rates by region, industry and occupation, 2-8 a 7 A. Displacement rates by region of residence/work b AUS CAN FRA JPN KOR RUS DEU DNK FIN GBR PRT SWE Self-defined displacement Firm-identified displacement 4. B. Ratio of displacement rate for each industry to the average Manufacturing Construction f AUS CAN KOR NZL FR RUS JPN DNK FIN DEU PRT SWE GBR Self-defined displacement Firm-identified displacement C. Ratio of displacement rate for each group to that of managers Craft and machine operators Associate professional, technicians and clerks f AUS CAN FRA KOR NZD RUS JPN DNK FIN GBR PRT SWE Self-defined displacement Firm-identified displacement Note: Logarithmic scales for Panels B and C. a) See Annex A1 for a full description of the samples, years and definitions used for each country. b) Displacement rates are calculated as the percentage of employees aged 2-64 who are displaced from one year to the next. They refer to the region of residence in countries where displacement is self-defined and the region of work for countries where firm-identified displacement rates are used. Source: Compiled by the OECD Secretariat using data sources described in Annex A1. BACK TO WORK: RE-EMPLOYMENT, EARNINGS AND SKILL USE AFTER JOB DISPLACEMENT OECD 213

20 2 FINAL REPORT 3. Getting back to work after job displacement This section examines how long it takes workers to get back to work after displacement and the groups that are most at risk of losing touch with the labour market. The data available do not allow for examination of the average time spent out of work after displacement in a manner that is comparable across countries. Instead, annual data on employment status are used to determine the proportion of displaced workers who are employed within one and two years of displacement. 9 For example, a worker who is observed in April each year and who is displaced between April 27 and April 28 is said to be re-employed within one year if he/she is employed in April 28 and to be re-employed within two years if employed in April 29 (regardless of whether or not he/she was employed in April 28). This method tends to underestimate true re-employment rates because workers may be employed for some of the period following displacement but not in the month when they are observed again. By contrast, it may overestimate the extent of stable re-employment because workers may be employed in the month when they are observed but lose their new job quickly afterwards. It is not possible to determine how these biases vary across countries. These limitations and the other differences in the data and estimation methods used, as outlined in Section 1, should be kept in mind when making cross-country comparisons of re-employment rates. Re-employment rates Figure 6 shows the proportion of displaced workers who were re-employed within one and two years in each of the countries for which data are available. 1 Re-employment rates within one year of displacement range from around 3 in France and Portugal to more than 8 in Finland and Sweden. Several countries showed a marked improvement in re-employment rates between the first and second year after displacement, notably Korea and Canada. However, comparisons across countries should be made with caution for the reasons noted above. What is clear is that re-employment rates fell markedly across all countries during the Great Recession. The biggest falls were in Denmark, the United States and Portugal, which all suffered a large increase in unemployment. However, large falls in re-employment rates were also recorded in Australia and Korea where unemployment rates were much less affected. Which workers take the longest to get back to work? The speed of re-employment varies considerably across different demographic groups. Figure 7 shows the relative re-employment rates of various groups. Men have higher re-employment rates than women in most countries, although this trend was reversed in Denmark and Finland during the Great Recession. Low-educated people also have lower re-employment rates than those with post-school qualifications in all the countries for which data are available except New Zealand. The relative situation of the low-skilled deteriorated during the Great Recession in Denmark, Finland and France, but improved in Portugal and, to a lesser extent, in Canada. The evidence is mixed when comparing youth (aged 2-24 years) with prime-aged people (3-44 years), with youth getting back to work more quickly in Australia, Canada, Japan, Korea, Germany and Portugal, but more slowly in several other countries, notably France and the Russian Federation. However, older people (aged -64 years) are less likely to be working within a year of displacement than prime-aged people in all the countries examined, particularly in France, Germany and Portugal where re-employment rates for older people are less than half those for prime-aged people. BACK TO WORK: RE-EMPLOYMENT, EARNINGS AND SKILL USE AFTER JOB DISPLACEMENT OECD 213

21 AUS CAN KOR NZL FRA RUS JPN DNK FIN DEU PRT SWE GBR USA AUS CAN KOR NZL FRA DNK FIN DEU PRT SWE AUS CAN KOR NZL FRA RUS JPN DNK FIN DEU PRT SWE GBR USA AUS CAN KOR NZL FRA RUS JPN DNK FIN DEU PRT SWE GBR USA FINAL REPORT 21 Figure 6. Re-employment after displacement a Proportion of displaced workers who are re-employed within one and two years, 2-8 and 29-1 averages 1 1 Re-employed Re-employed Re-employed Re-employed Re-employed Re-employed fc FRA KORwithin within CAN one year one year JPN RUS USA within NZL within two AUS two years years PRT GBR DEU within DNK within one year USA one year FIN SWE (2-8) (2-8) (29-1) (2-8) Self-defined displacement (2-8) Firm-identified (29-1) displacement FRA KOR CAN JPN RUS USA NZL AUS PRT GBR DEU DNK USA FIN SWE Self-defined displacement Firm-identified displacement a) See Annex A1 for a full description of the samples, years and definitions used for each country. Source: Compiled by the OECD Secretariat using data sources described in Annex A1. Figure 7. Relative re-employment rates by characteristics a Averages A. Men (vs. women) B years (vs years) Self-defined displacement Firm-identified displacement Self-defined displacement Firm-identified displacement 2. C. -64 years (vs years) D. Less than secondary education (vs. post-secondary) Note: Logarithmic scales. Self-defined displacement Firm-identified displacement Self-defined displacement a) Each panel shows the ratio of the re-employment rate for each group to that of the comparison group. See Annex A1 for a full description of the samples, years and definitions used for each country. Source: Compiled by the OECD Secretariat using data sources described in Annex A1. Firm-identified displacement BACK TO WORK: RE-EMPLOYMENT, EARNINGS AND SKILL USE AFTER JOB DISPLACEMENT OECD 213
22 22 FINAL REPORT As for displacement rates, re-employment rates vary markedly across regions (Figure 8), with the largest dispersion observed in Australia, France and the Russian Federation and the least in Denmark and Japan. Interestingly, in the Russian Federation displacement rates vary little across the three main regions reported while re-employment differ significantly. The opposite is true for Portugal where regions vary markedly in displacement rates but are more similar as far as re-employment rates are concerned. Indeed, not one-way association is found between displacement and re-employment rates, with some countries exhibiting a positive/negative relationship and others no relationship at all. Thus, the hypothesis that higher displacement rates tend to be accompanied by higher re-employment rates, signalling higher labour market dynamism may not hold in all countries. Figure 8. Re-employment rates by region, 2-8 a Proportion of re-employed displaced workers one year after displacement, by region AUS FRA JPN KOR RUS DEU DNK FIN PRT Self-defined displacement Firm-identified displacement a) See Annex A1 for a full description of the samples, years and definitions used for each country. Data refer to the region of residence in countries where displacement is self-defined and the region of work for countries where firm-identified displacement rates are used. Source: Compiled by the OECD Secretariat using data sources described in Annex A1. What happens to displaced workers who are not re-employed? On average during the 2s, around of displaced workers are not employed within one year and 3 remain out of work one year later. For a sub-set of countries, it is possible to identify the main activity of those who are not employed to better understand post-displacement outcomes. Three main labour force states are examined in Figure 9: working (as an employee or self-employed); unemployed (i.e. not working but searching actively for work and available to start work); and not in the labour force (i.e. not working and either not searching actively for work or not available to start work or both). Within a year of displacement, the majority of those not working are unemployed in Canada, Japan and the United States, whereas a majority are not in the labour force in the other countries examined. Within two years, with the exception of the Russian Federation, there is a sizeable drop in the proportion unemployed in all countries and a smaller fall in the proportion that remains out of the labour force. This suggests that those who remain searching for work are more likely to re-enter employment within two years than those who are less connected with the labour force after one year. BACK TO WORK: RE-EMPLOYMENT, EARNINGS AND SKILL USE AFTER JOB DISPLACEMENT OECD 213
23 Working Unemployed NILF Working Unemployed NILF Working Unemployed NILF Working Unemployed NILF Working Unemployed NILF Working Unemployed NILF Working Unemployed NILF W U N W U N W U N W U N W U N W U N W U N FINAL REPORT 23 Figure 9. Labour force status of displaced workers after displacement, average 2-1 a Within Within one one year year after after displacement Within two Within years two after years displacement after displacement fc KOR JPN RUS USA CAN NZL AUS KOR JPN RUS USA CAN NZL AUS NILF: Not in the labour force. a) Only countries using self-defined displacement have data available on labour force status after displacement. See Annex A1 for a full description of the samples, years and definitions used for each country. Source: Compiled by the OECD Secretariat using data sources described in Annex A1. Among those who have not re-entered work within one year of displacement, women are more likely than men to be out of the labour force, as are older people and those with lower levels of education (Table 2). These patterns are similar in all the countries examined. This may not be of concern if people give up searching for work in order to undertake education or training or to care for children or sick or elderly relatives. However, very few displaced workers are in full-time education or training within one year of displacement and those that are tend to have higher levels of education already. Many older displaced workers who are not re-employed retire completely from the labour force. Table 2. Percentage of non-working displaced workers who are not in the labour force within one year of displacement, by characteristics, average 2-1 a Australia Canada France Japan Korea New Zealand Russian Federation United States Men Women years years years Less than secondary Secondary Post-secondary Data not available. a) Only countries using self-defined displacement have data available on labour force status after displacement. See Annex A1 for a full description of the samples, years and definitions used for each country. Source: Compiled by the OECD Secretariat using data sources described in Annex A1. BACK TO WORK: RE-EMPLOYMENT, EARNINGS AND SKILL USE AFTER JOB DISPLACEMENT OECD 213
24 24 FINAL REPORT 4. Earnings, hours and working arrangements after displacement The previous section showed that most displaced workers get back into a new job within one or two years. However, the effects of displacement on their pay and working arrangements can be longerlasting. This section examines the post-displacement earnings, hours, job security and other working arrangements of displaced workers. Due to data limitations, not all aspects could be examined for every country. A full analysis of the interaction between post-displacement pay and working arrangements, notably to examine whether workers trade off higher pay for better working arrangements (or vice versa) is beyond the scope of this report but would be a fruitful area for future research. Earnings losses after displacement 11 The simplest way to determine the scale of earnings losses after displacement would be to compare workers earnings before and after displacement and compute the difference. However, this is likely to underestimate the true cost of displacement because displaced workers are likely to have missed out on wage rises that would have occurred in their previous job had they not been displaced. The seminal paper of Jacobson et al. (1993) attempted to more accurately measure the cost of displacement by comparing earnings changes for displaced workers before and after displacement with those for workers who were not displaced. This difference-in-differences approach has proven very influential and there is an extensive literature examining post-displacement earnings and wage losses in many OECD countries using methods similar to that of Jacobson et al. (1993) (see Annex A2 for a review). Accurate comparisons across country studies are very difficult to make because of differences in the definition of displacement, measures of earnings/wages and year and groups of workers on which authors focus. Nevertheless, the largest hourly, weekly or monthly wage losses appear to be found in Germany, Italy, the United Kingdom and the United States. On the other hand, in Belgium and Japan, wage losses are estimated to be rather low. Quarterly or annual earnings losses are larger than monthly, weekly or hourly wage losses as they reflect the combined effect of periods of non-employment and reductions in hourly wages or hours worked. For instance, earnings losses of about 3 are found in France compared with wage losses of about 9. Similarly, in the United States, earnings losses range from 21 to 6 while wage losses are more modest varying between 8 and 16. In studies where long time-series of data following displacement are available, the size of earnings and wage losses tend to decline over time, but generally persist for a number of years following displacement. Some studies also find that wages and earnings decline albeit modestly in the years leading up to displacement. In an attempt to provide comparable cross-country estimates of the impact of displacement on earnings, this report adopts a methodology based on Jacobson et al. (1993) and applies it to a similar sample of workers and years from broadly-comparable data sources for several OECD countries (see Box 1 for a full explanation of the methodology used). Most of the results presented below are estimates of real gross annual earnings losses in the years leading up to and after displacement due to a mass dismissal or firm closure for workers. They include losses due to lower wage rates, shorter hours as well as periods of non-employment when the displaced worker had no earnings. Periods of non-employment/earnings are included so that the full financial cost of displacement can be assessed, 12 but also because reliable estimates of monthly wage effects could not be made for most of the countries examined. However, for Germany, Portugal and the United Kingdom, estimates of monthly wage effects for workers with non-zero earnings in each year after displacement are calculated and are discussed in the text where relevant. BACK TO WORK: RE-EMPLOYMENT, EARNINGS AND SKILL USE AFTER JOB DISPLACEMENT OECD 213
ANTICIPATING POPULATION AGEING CHALLENGES AND RESPONSES. Peter Whiteford Social Policy Division, OECD www.oecd.org www.oecd.
 ANTICIPATING POPULATION AGEING CHALLENGES AND RESPONSES Peter Whiteford Social Policy Division, OECD www.oecd.org www.oecd.org/els Outline z z z What is the OECD and what does it do? Anticipating the challenges
B Financial and Human Resources
 Chapter B Financial and Human Resources Invested In Education Education at a Glance OECD 2011 203 chapter B Classification of al expenditure Educational expenditure in this chapter is classified through
Transfer issues and directions for reform: Australian transfer policy in comparative perspective
 Transfer issues and directions for reform: Australian transfer policy in comparative perspective Peter Whiteford, Social Policy Research Centre, University of New South Wales p.whiteford@unsw.edu.au 1
Dualization and crisis. David Rueda
 Dualization and crisis David Rueda The economic crises of the 20 th Century (from the Great Depression to the recessions of the 1970s) were met with significant increases in compensation and protection
Government at a Glance 2015
 Government at a Glance 2015 Size of public procurement Strategic public procurement E-procurement Central purchasing bodies 135 Size of public procurement Public procurement refers to the purchase by governments
VULNERABILITY OF SOCIAL INSTITUTIONS
 VULNERABILITY OF SOCIAL INSTITUTIONS 2 December 2014 Paris Seminar in Demographic Economics Falilou FALL Senior Economist OECD Economics Department 1 Introduction and outline Social institutions and the
DEBT LEVELS AND FISCAL FRAMEWORKS. Christian Kastrop Director of Policy Studies Branch Economics Department
 DEBT LEVELS AND FISCAL FRAMEWORKS Christian Kastrop Director of Policy Studies Branch Economics Department Introduction OECD average gross government debt increased from 73% of GDP in 2007 to 111% in 2013.
MENTAL HEALTH AND WORK Policy challenges and policy developments in OECD countries
 MENTAL HEALTH AND WORK Policy challenges and policy developments in OECD countries Shruti Singh, Labour Market Economist Directorate for Employment, Labour and Social Affairs Global Healthy Workplace Awards
Most people in Germany attain upper secondary education
 Education at a Glance: OECD Indicators is the authoritative source for accurate and relevant information on the state of education around the world. It provides data on the structure, finances, and performance
Job quality across OECD countries
 HOW GOOD IS YOUR JOB? MEASURING AND ASSESSING JOB QUALITY What makes a good job? Job quality Most people spend a substantial amount of time at work, and work for a significant part of their life. The jobs
Who wants to be an entrepreneur?
 Entrepreneurship at a Glance 215 Key findings: Italy Who wants to be an entrepreneur? In all the economies of the world, entrepreneurship is key for economic development and to promoting social integration
OECD THEMATIC FOLLOW-UP REVIEW OF POLICIES TO IMPROVE LABOUR MARKET PROSPECTS FOR OLDER WORKERS. DENMARK (situation mid-2012)
") OECD THEMATIC FOLLOW-UP REVIEW OF POLICIES TO IMPROVE LABOUR MARKET PROSPECTS FOR OLDER WORKERS DENMARK (situation mid-2012) MACROBUTTON NUMBERING (SITUATION In 2011, the employment rate for the population
OECD THEMATIC FOLLOW-UP REVIEW OF POLICIES TO IMPROVE LABOUR MARKET PROSPECTS FOR OLDER WORKERS DENMARK (situation mid-2012) MACROBUTTON NUMBERING (SITUATION In 2011, the employment rate for the population
Trends in part-time and temporary work
 Trends in part-time and temporary work This analysis has been carried out using the latest available quarterly data from the Labour Force Survey. This was used to examine trends in temporary and part-time
Belgium (Fr.) Australia. Austria. England. Belgium (Fl.) United States 2. Finland 2. Norway 2. Belgium (Fr.) Australia. Austria Norway 2, 4.
 Australia. Austria. England. Belgium (Fl.) United States 2. Finland 2. Norway 2. Belgium (Fr.) Australia. Austria Norway 2, 4.") How Much Are Teachers Paid? Indicator The statutory salaries of teachers with at least 15 years of experience average USD 38 914 at the primary level, USD 41 701 at the lower level and USD 43 711 at the
How Much Are Teachers Paid? Indicator The statutory salaries of teachers with at least 15 years of experience average USD 38 914 at the primary level, USD 41 701 at the lower level and USD 43 711 at the
Access to meaningful, rewarding and safe employment is available to all.
 Home Previous Reports Links Downloads Contacts The Social Report 2002 te purongo oranga tangata 2002 Introduction Health Knowledge and Skills Safety and Security Paid Work Human Rights Culture and Identity
What Is the Student-Teacher Ratio and How Big
 What Is the Student-Teacher Ratio and How Big Are Classes? The average class in primary education in OECD countries has more than 21 students. Among all countries with available data, this number varies
Earnings related schemes: Design, options and experience. Edward Whitehouse
 Earnings related schemes: Design, options and experience Edward Whitehouse World Bank core course Washington DC, March 2014 Objectives Primary objective: ensuring older people have a decent standard of
UNEMPLOYMENT BENEFITS WITH A FOCUS ON MAKING WORK PAY
 EUROPEAN SEMESTER THEMATIC FICHE UNEMPLOYMENT BENEFITS WITH A FOCUS ON MAKING WORK PAY Thematic fiches are supporting background documents prepared by the services of the Commission in the context of the
FISCAL CONSOLIDATION: HOW MUCH IS NEEDED TO REDUCE DEBT TO A PRUDENT LEVEL?
 Please cite this paper as: OECD (1), Fiscal Consolidation: How Much is Needed to Reduce Debt to a Prudent Level?, OECD Economics Department Policy Notes, No. 11, April. ECONOMICS DEPARTMENT POLICY NOTE
How Does Educational Attainment Affect Participation in the Labour Market?
 Indicator How Does Educational Attainment Affect Participation in the Labour Market? In all countries, individuals with a tertiary-level degree have a greater chance of being employed than those without
Impact of the recession
 Regional Trends 43 21/11 Impact of the recession By Cecilia Campos, Alistair Dent, Robert Fry and Alice Reid, Office for National Statistics Abstract This report looks at the impact that the most recent
When Will the U.S. Job Market Recover?
 March 2012 In this newsletter, we focus on the U.S. job market. The economic recovery post-2008 is often referred to as a "jobless recovery" given the persistently high unemployment rate. In this paper
While a large proportion of adults in the United States have universitylevel
 Education at a Glance: OECD Indicators is the authoritative source for accurate and relevant information on the state of education around the world. It provides data on the structure, finances, and performance
International Women's Day PwC Women in Work Index
 www.pwc.co.uk International Women's Day Women in Work Index Women in Work Index UK rises four places to 14 th position within the OECD, returning to its position in 2000. The third annual update of the
OECD THEMATIC FOLLOW-UP REVIEW OF POLICIES TO IMPROVE LABOUR MARKET PROSPECTS FOR OLDER WORKERS. SWITZERLAND (situation mid-2012)
") OECD THEMATIC FOLLOW-UP REVIEW OF POLICIES TO IMPROVE LABOUR MARKET PROSPECTS FOR OLDER WORKERS SWITZERLAND (situation mid-2012) In 2011, the employment rate for the population aged 50-64 in Switzerland
OECD THEMATIC FOLLOW-UP REVIEW OF POLICIES TO IMPROVE LABOUR MARKET PROSPECTS FOR OLDER WORKERS SWITZERLAND (situation mid-2012) In 2011, the employment rate for the population aged 50-64 in Switzerland
G20 EMPLOYMENT WORKING GROUP COUNTRY SELF-REPORTING TEMPLATE ON IMPLEMENTATION OF G20 EMPLOYMENT PLANS
 G20 EMPLOYMENT WORKING GROUP COUNTRY SELF-REPORTING TEMPLATE ON IMPLEMENTATION OF G20 EMPLOYMENT PLANS Contents 1. Key economic and labour market indicators 2. Key policy indicators 3. Checklist of commitments
Appendix. Appendix Figure 1: Trends in age-standardized cardiometabolic (CVD and diabetes) mortality by country.
 mortality by country.") Appendix Appendix Figure 1: Trends in age-standardized cardiometabolic (CVD and diabetes) mortality by country. Men Age standardized cardiometabolic death rate per 100,000 800 700 600 500 400 300 200 800
Appendix Appendix Figure 1: Trends in age-standardized cardiometabolic (CVD and diabetes) mortality by country. Men Age standardized cardiometabolic death rate per 100,000 800 700 600 500 400 300 200 800
Education at a Glance 2008. OECD Technical Note For Spain
 Education at a Glance 2008 NO MEDIA OR WIRE TRANSMISSION BEFORE 9 SEPTEMBER 2008, 11:00 PARIS TIME OECD Technical Note For Spain Governments are paying increasing attention to international comparisons
2. Higher education and basic research
 2. Higher education and basic research DNK SWE CHE AUT EST FIN ISL CAN NLD AUS ISR CZE NOR PRT DEU BEL JPN FRA EU28 OECD GBR TUR USA KOR IRL NZL ITA ESP GRC SVK SVN POL ZAF HUN LUX CHN CHL MEX RUS Higher
Young Italians difficulties in finding work threaten to undermine investment in education.
 Education at a Glance: OECD Indicators is the authoritative source for accurate and relevant information on the state of education around the world. It provides data on the structure, finances, and performance
Special Feature: Trends in personal income tax and employee social security contribution schedules
 Special Feature: Trends in personal income tax and employee social security contribution schedules TAXING WAGES 211 OECD 212 27 1. Introduction Taxes on labour income including personal income taxes and
The 2013 Follow-Up Survey of Former FÁS Trainees who Exited Training in May and June 2012
 The 2013 Follow-Up Survey of Former FÁS Trainees who Exited Training in May and June 2012 Authors: John McGrath Ivica Milicevic FÁS / SOLAS, Research and Planning Skills and Labour Market Research Unit
WHAT ROLE FOR PRIVATE EMPLOYMENT SERVICES ON THE LABOUR MARKET?
 CIETT World Employment Conference 28 th May 2015, Rome WHAT ROLE FOR PRIVATE EMPLOYMENT SERVICES ON THE LABOUR MARKET? Stefano Scarpetta Director of Employment, Labour and Social Affairs OECD KEY CHALLENGES
INCOME INEQUALITY SOCIAL MOBILITY AND ECONOMIC GROWTH*
 NERO Conference Paris, 22 June 2015 INCOME INEQUALITY SOCIAL MOBILITY AND ECONOMIC GROWTH* Federico Cingano, ELS Employment Analysis Division *Source: OECD (2015) In It Together: Why less inequality benefits
Public and Private Sector Earnings - March 2014
 Public and Private Sector Earnings - March 2014 Coverage: UK Date: 10 March 2014 Geographical Area: Region Theme: Labour Market Theme: Government Key Points Average pay levels vary between the public and
Cross-country comparison of health care system efficiency
 Cross-country comparison of health care system efficiency Isabelle Joumard, OECD, Economics Department IMF conference, June 21, 2011 Public Health Care Reforms: Challenges and Lessons for Advanced and
Health and welfare Humanities and arts Social sciences, bussiness and law. Ireland. Portugal. Denmark. Spain. New Zealand. Argentina 1.
 Indicator to Which fields of education are students attracted? Women represent the majority of students and graduates in almost all OECD countries and largely dominate in the fields of education, health
CLOSING THE COVERAGE GAP. Robert Palacios, World Bank Pension Core Course March 2014
 CLOSING THE COVERAGE GAP Robert Palacios, World Bank Pension Core Course March 2014 Different types of coverage gaps 2 In a subset of richer countries, the main kind of gap is related to adequacy rather
INCOME INEQUALITY AND GROWTH: THE ROLE OF TAXES AND TRANSFERS
 Please cite this paper as: OECD 2012, Income inequality and growth: The role of taxes and transfers, OECD Economics Department Policy Notes, No. 9. January 2012. ECONOMICS DEPARTMENT POLICY NOTE No. 9
work Women looking for Discussions of the disadvantage faced by women
 by Ghazala Azmat, Maia Güell and Alan Manning Women looking for work Female unemployment rates differ widely from county to country. Ghazala Azmat, Maia Güell and Alan Manning look for the reasons that
The Interaction of Workforce Development Programs and Unemployment Compensation by Individuals with Disabilities in Washington State
 Number 6 January 2011 June 2011 The Interaction of Workforce Development Programs and Unemployment Compensation by Individuals with Disabilities in Washington State by Kevin Hollenbeck Introduction The
Men retiring early: How How are they doing? Dave Gower
 Men retiring early: How retiring are they doing? early: How are they doing? Dave Gower During the first half of this century, men generally stayed in the labour force until at least age 65. In the second
Women at work: who are they and how are they faring?
 Chapter 2 Women at work: who are they and how are they faring? This chapter analyses the diverse labour market experiences of women in OECD countries using comparable and detailed data on the structure
INTERNATIONAL COMPARISONS OF PART-TIME WORK
 OECD Economic Studies No. 29, 1997/II INTERNATIONAL COMPARISONS OF PART-TIME WORK Georges Lemaitre, Pascal Marianna and Alois van Bastelaer TABLE OF CONTENTS Introduction... 140 International definitions
EUROPEAN AREA OF SKILLS AND QUALIFICATIONS
 EUROPEAN AREA OF SKILLS AND QUALIFICATIONS REPORT Fieldwork: April - May 2014 Publication: June 2014 This survey has been requested by the European Commission, Directorate-General for Education and Culture
July 2015. Figure 1. 1 The index is set to 100 in 2000. House prices are deflated by country CPIs in most cases.
 July 2015 Globally, house prices continue a slow recovery. The Global House Price Index, an equally weighted average of real house prices in nearly 60 countries, inched up slowly during the past two years
How To Calculate Tertiary Type A Graduation Rate
 Indicator How Many Students Finish Tertiary Education? Based on current patterns of graduation, it is estimated that an average of 46% of today s women and 31% of today s men in OECD countries will complete
Employment Protection Regulation and Labour Market Performance
 ISBN 92-64-10812-2 OECD Employment Outlook OECD 2004 Chapter 2 Employment Protection Regulation and Labour Market Performance There has been heated policy debate on the costs and benefits of regulations
SF2.2: Ideal and actual number of children
 Definitions and methodology SF.: Ideal and actual number of children Childbearing preferences are difficult to measure since they depend on different factors, including social norms, personal circumstances,
Family policies and the on-going economic crisis
 Family policies and the on-going economic crisis Leave Policies & Research Network meeting, Paris, 17 October 2013 Willem Adema Senior Economist, Social Policy Division, OECD Diverse trends in family outcomes
THE PERCEPTION OF TECHNOLOGY as a principal
 Liberal arts degrees and the labour market Philip Giles and Torben Drewes THE PERCEPTION OF TECHNOLOGY as a principal driver in economic change and widely publicized reports of skill shortages in the information
How To Understand How Unemployment Affects Different Groups In Nelson
 Exemplar for internal assessment resource Economics for Achievement Standard 91225 Exemplar for Internal Achievement Standard Economics Level 2 This exemplar supports assessment against: Achievement Standard
Recent reports of corporate downsizing,
 Into contingent and alternative employment: by choice? Workers enter contingent and alternative arrangements from many different activities and for a wide variety of reasons; while some workers are involuntarily
What Are the Incentives to Invest in Education?
 Indicator What Are the Incentives to Invest in Education? On average across 25 OECD countries, the total return (net present value), both private and public, to a man who successfully completes upper secondary
The Recession of 2007 2009
 The Recession of 2007 2009 February 2012 A general slowdown in economic activity, a downturn in the business cycle, a reduction in the amount of goods and services produced and sold these are all characteristics
COMMISSION STAFF WORKING DOCUMENT. Situation of young people in the EU. Accompanying the document
 EUROPEAN COMMISSION Brussels, 15.9.2015 SWD(2015) 169 final PART 2/6 COMMISSION STAFF WORKING DOCUMENT Situation of young people in the EU Accompanying the document Communication from the Commission to
INTERNATIONAL COMPARISONS OF HOURLY COMPENSATION COSTS
 For release 10:00 a.m. (EST) Tuesday, March 8, 2011 USDL-11-0303 Technical Information: (202) 691-5654 ilchelp@bls.gov www.bls.gov/ilc Media Contact: (202) 691-5902 PressOffice@bls.gov INTERNATIONAL COMPARISONS
How To Earn More Money In The United States
 Education at a Glance 2011 OECD Indicators DOI: http://dx.doi.org/10.1787/eag-2011-en OECD 2011 Under embargo until 13 September, at 11:00 Paris time COUNTRY NOTE UNITED STATES Questions can be directed
THE CHARACTERISTICS AND QUALITY OF SERVICE SECTOR JOBS
 Chapter 3 THE CHARACTERISTICS AND QUALITY OF SERVICE SECTOR JOBS Summary The share of employment in services continued to rise in virtually all OECD countries over the 1990s, approaching nearly three-quarters
RETAIL FINANCIAL SERVICES
 Special Eurobarometer 373 RETAIL FINANCIAL SERVICES REPORT Fieldwork: September 211 Publication: April 212 This survey has been requested by the European Commission, Directorate-General Internal Market
SF3.1: Marriage and divorce rates
 Marriage rates Definitions and methodology SF3.1: Marriage and divorce rates The crude marriage rate is the number of marriages formed each year as a ratio to 1 000 people. This measure disregards other
RETAIL FINANCIAL SERVICES
 Special Eurobarometer 373 RETAIL FINANCIAL SERVICES REPORT Fieldwork: September 211 Publication: March 212 This survey has been requested by Directorate-General Internal Market and Services and co-ordinated
COMPARING SOCIAL MODELS IN SEARCH OF INCOME AND JOB/EMPLOYMENT SECURITY: UNEMPLOYMENT BENEFITS VS SHORT TIME WORK COMPENSATIONS
 COMPARING SOCIAL MODELS IN SEARCH OF INCOME AND JOB/EMPLOYMENT SECURITY: UNEMPLOYMENT BENEFITS VS SHORT TIME WORK COMPENSATIONS Silvia Spattini Researcher ADAPT Marco Biagi Centre for International and
Women s Earnings and Income
 Earnings and Income of U.S. Women and Men The median annual earnings for full-time, year-round women workers in 2010 was $36,931 compared to men s $47,715. 1 In 2011, the median weekly earnings for full-time
The self-employed and pensions
 BRIEFING The self-employed and pensions Conor D Arcy May 2015 resolutionfoundation.org info@resolutionfoundation.org +44 (0)203 372 2960 The self-employed and pensions 2 The UK s self-employed populace
Ageing of the Labour Force in OECD Countries: Economic and Social Consequences
 EMPLOYMENT PAPER 2000/2 Ageing of the Labour Force in OECD Countries: Economic and Social Consequences Peter Auer Mariàngels Fortuny Employment Sector International Labour Office Geneva Foreword Because
International Labor Comparisons
 Charting International Labor Comparisons 2010 Edition U.S. Department of Labor Material contained in this document is in the public domain and may be reproduced, fully or partially, without permission
Tax Reform Trends in OECD Countries
 OECD 50 TH ANNIVERSARY CHALLENGES IN DESIGNING COMPETITIVE TAX SYSTEMS Paris, 30 June 2011 Tax Reform Trends in OECD Countries 1. Introduction 1. Over the last two decades almost all OECD countries have
Financial capability and saving: Evidence from the British Household Panel Survey
 CRS02 NOVEMBER 2010 Financial capability and saving: Evidence from the British Household Panel Survey About the Consumer Financial Education Body The Consumer Financial Education Body (CFEB) is an independent
4. Work and retirement
 4. Work and retirement James Banks Institute for Fiscal Studies and University College London María Casanova Institute for Fiscal Studies and University College London Amongst other things, the analysis
How many students study abroad and where do they go?
 From: Education at a Glance 2012 Highlights Access the complete publication at: http://dx.doi.org/10.1787/eag_highlights-2012-en How many students study abroad and where do they go? Please cite this chapter
Working After Age 65
 ALTERNATIVE FEDERAL BUDGET 2012 TECHNICAL PAPER Working After Age 65 What is at Stake? Angella MacEwen Highlights The OAS and GIS combined today provide one third of the income of all seniors aged over
What Proportion of National Wealth Is Spent on Education?
 Indicator What Proportion of National Wealth Is Spent on Education? In 2008, OECD countries spent 6.1% of their collective GDP on al institutions and this proportion exceeds 7.0% in Chile, Denmark, Iceland,
Education at a Glance. Update of Employment and Educational Attainment Indicators
 Education at a Glance Interim Report: Update of Employment and Educational Attainment Indicators Education at a Glance Interim Report: Update of Employment and Educational Attainment Indicators January
International Retirement Security Survey
 International Retirement Security Survey July 00 (Copyright 00 by AARP. All rights reserved.) www.harrisinteractive.com www.intlaffairs@aarp.org Table of Contents I. Background and Objectives II. III.
OECD Insights Human Capital: How what you know shapes your life
 OECD Insights Human Capital: How what you know shapes your life Summary in English The world of work has seen enormous change over the past couple of decades. Manufacturing jobs account for an ever smaller
How Many Students Will Enter Tertiary Education?
 How Many Students Will Enter Tertiary Education? Indicator Based on current patterns of entry, it is estimated that an average of 59% of today s young adults in OECD countries will enter tertiary-type
Country note China. More than 255 million people in OECD and G20 countries have now attained tertiary education (Table A1.3a).
.") Education at a Glance 2011 OECD Indicators DOI: http://dx.doi.org/10.1787/eag-2011-en OECD 2011 Under embargo until 13 September, at 11:00 Paris time Education at a Glance 2011 Country note China Questions
Education at a Glance 2011 OECD Indicators DOI: http://dx.doi.org/10.1787/eag-2011-en OECD 2011 Under embargo until 13 September, at 11:00 Paris time Education at a Glance 2011 Country note China Questions
Under embargo until 11 September, at 11:00 am Paris time
 COUNTRY NOTE Education at a Glance:OECD Indicators 2012 Under embargo until 11 September, at 11:00 am Paris time CANADA Questions can be directed to: Andreas Schleicher, Advisor to the Secretary-General
WOMEN IN DECISION-MAKING POSITIONS
 Special Eurobarometer 376 WOMEN IN DECISION-MAKING POSITIONS REPORT Fieldwork: September 2011 Publication: March 2012 This survey has been requested by Directorate-General Justice and co-ordinated by Directorate-
Pan-European opinion poll on occupational safety and health
 PRESS KIT Pan-European opinion poll on occupational safety and health Results across 36 European countries Press kit Conducted by Ipsos MORI Social Research Institute at the request of the European Agency
The table Key facts for Brazil in Education at a Glance 2015 presents a summary of figures for Brazil and the OECD average.
 Education at a Glance: OECD Indicators is the authoritative source for information on the state of education around the world. It provides data on the structure, finances and performance of education systems
How Many Students Finish Secondary Education?
 Indicator How Many Students Finish Secondary Education? Based on current patterns of graduation, it is estimated that an average of 82% of today s young people in OECD countries will complete upper secondary
and monetary developments
 economic developments box 8 unemployment developments in the euro area The situation in euro area s has worsened significantly since the start of the economic and financial crisis in 28. After reaching
Adult Education Survey 2006, European comparison
 Education 2009 Adult Education Survey 2006, European comparison Adults in the Nordic countries actively participate in education and training Persons aged 25 to 64 who live in the Nordic countries (Finland,
EUROPE 2020 TARGET: TERTIARY EDUCATION ATTAINMENT
 EUROPE 2020 TARGET: TERTIARY EDUCATION ATTAINMENT Low tertiary or equivalent education attainment levels create skills bottlenecks in knowledgeintensive economic sectors and hamper productivity, innovation
The Decline in Student Applications to Computer Science and IT Degree Courses in UK Universities. Anna Round University of Newcastle
 The Decline in Student Applications to Computer Science and IT Degree Courses in UK Universities Introduction Anna Round University of Newcastle The research described in this report was undertaken for
Monitoring the social impact of the crisis: public perceptions in the European Union (wave 6) REPORT
 REPORT") Eurobarometer Monitoring the social impact of the crisis: public perceptions in the European Union (wave 6) REPORT Fieldwork: December 2011 Publication: April 2012 This survey has been requested by Directorate-General
Eurobarometer Monitoring the social impact of the crisis: public perceptions in the European Union (wave 6) REPORT Fieldwork: December 2011 Publication: April 2012 This survey has been requested by Directorate-General
What Is the Total Public Spending on Education?
 What Is the Total Public Spending on Education? Indicator On average, OECD countries devote 12.9% of total public expenditure to, but values for individual countries range from less than 10% in the Czech
USING CURRENT POPULATION SURVEY DATA TO EXAMINE SCHOOL ADMINISTRATORS CAREERS
 Appendix D USING CURRENT POPULATION SURVEY DATA TO EXAMINE SCHOOL ADMINISTRATORS CAREERS The Current Population Survey (CPS) is a monthly household survey conducted by the Bureau of the Census for the
Society at a Glance 2011 OECD SOCIAL INDICATORS
 Society at a Glance 211 SOCIAL INDICATORS Society at a Glance 211 SOCIAL INDICATORS This work is published on the responsibility of the Secretary-General of the. The opinions expressed and arguments employed
An international comparison of apprentice pay: Executive Summary. Low Pay Commission
 An international comparison of apprentice pay: Low Pay Commission October 2013 About is one of Europe's leading specialist economics and policy consultancies and has its head office in London. We also
Delegation in human resource management
 From: Government at a Glance 2009 Access the complete publication at: http://dx.doi.org/10.1787/9789264075061-en Delegation in human resource management Please cite this chapter as: OECD (2009), Delegation
User language preferences online. Analytical report
 Flash Eurobarometer 313 The Gallup Organization Flash Eurobarometer European Commission User language preferences online Analytical report Fieldwork: January 2011 Publication: May 2011 This survey was
Improving Skills for More and Better Jobs: Does Training Make adifference?
 ISBN 92-64-10812-2 OECD Employment Outlook OECD 2004 Chapter 4 Improving Skills for More and Better Jobs: Does Training Make adifference? It is often claimed that upgrading workers skills could help meet
Changing Work in Later Life: A Study of Job Transitions Stephen McNair, Matt Flynn, Lynda Owen, Clare Humphreys, Steve Woodfield
 UniS Changing Work in Later Life: A Study of Job Transitions Stephen McNair, Matt Flynn, Lynda Owen, Clare Humphreys, Steve Woodfield Centre for Research into the Older Workforce Funded by Changing Work
Regional characteristics of foreignborn people living in the United Kingdom
 Regional characteristics of foreignborn people living in the United Kingdom By Alice Reid and Caroline Miller, Office for National Statistics Abstract This article examines the characteristics of foreign-born
Statistical Bulletin. Annual Survey of Hours and Earnings, 2014 Provisional Results. Key points
 Statistical Bulletin Annual Survey of Hours and Earnings, 2014 Provisional Results Coverage: UK Date: 19 November 2014 Geographical Areas: Country, European (NUTS), Local Authority and County, Parliamentary
Labour Force Survey: Q2/2015
 22 September 2015 1100 hrs 172/2015 During the second quarter of 2015, Labour Force Survey estimates indicate an increase of 1.8 per cent in employment when compared to the corresponding quarter of 2014.
INDUSTRY PROFILES. Educational Services Industry
 INDUSTRY PROFILES Educational Services Industry June 2012 Overview: The Educational Services industry 1 in Alberta includes: public and private schools, colleges, universities and training centres; instructional