Volume URL: Chapter Title: Military versus Civilian Pay: A Descriptive Discussion
|
|
|
- Augustus Preston
- 8 years ago
- Views:
Transcription
1 This PDF is a selection from an out-of-print volume from the National Bureau of Economic Research Volume Title: Public Sector Payrolls Volume Author/Editor: David A. Wise, ed. Volume Publisher: University of Chicago Press Volume ISBN: Volume URL: Publication Date: 1987 Chapter Title: Military versus Civilian Pay: A Descriptive Discussion Chapter Author: Douglas W. Phillips, David A. Wise Chapter URL: Chapter pages in book: (p )

2 2 Military versus Civilian Pay: A Descriptive Discussion Douglas W. Phillips and David A. Wise The goal of this chapter is to compare the compensation of persons who follow a career in the military with the compensation that similar individuals would expect if they were to follow a career in the civilian sector. While recruitment posters and television advertisements often emphasize the training to be had in the military, it is not common to base public recruitment efforts on pay comparisons. And while the military pension system is a very important component of compensation, it seems almost never mentioned in public recruitment efforts as one of the advantages of a military career. Casual observation suggests that many people believe that military pay is low. The basic approach followed in this chapter is to compare the compensation of military enlisted personnel with the compensation of high school graduates in the civilian sector, and to compare the compensation of officers with the compensation of college graduates in the civilian sector. Compensation is meant to include accrued Social Security benefits and accrued pension benefits. The comparison, however, excludes some forms of compensation in both the civilian and the military sectors, such as health benefits. Military salary is taken to be regular military compensation, the largest component of which is basic pay, accounting for 70 percent to 80 percent of regular military compensation. The basic allowance for quarters, the basic allowance for subsistence, and the federal income Douglas W. Phillips is a former research assistant at the National Bureau of Economic Research and is currently employed at S. G. Warburg & Company, Ltd., in London, England. David A. Wise is the John F. Stambaugh Professor of Political Economy at the John F. Kennedy School of Government, Harvard University, and a research associate at the National Bureau of Economic Research. 19

3 20 Douglas W. Phillips/David A. Wise tax advantage comprise the remaining portion of regular military compensation. The basic allowances are paid to members of the armed forces who do not receive room or board in kind from the military. The federal income tax advantage results from the tax-exempt status of these allowances and can account for 4 percent to 8 percent of regular compensation. Basic pay is subject to both the federal income tax and, since 1957, to Social Security tax. In addition to regular military compensation, some military personnel receive additional compensation in the form of hazardous duty pay, submarine duty pay, and so forth, but on average these types of compensation are small compared to regular compensation. Until 1967, military pay was much lower than wages or salaries in the private sector. Under the federal Pay Comparability Act of 1967, however, basic pay schedules along with other elements of regular military compensation must be adjusted to wage rate increases in the private sector. This act mandates that military wages be indexed to wage increases in the civil service, which in turn are indexed to wages in the private sector. One might conclude that this indexing makes a comparison of military and civilian compensation a totalogical exercise, but the nonsalary components of compensation are very different in the two sectors, even if true comparability with the civilian sector were maintained with respect to regular salary. In addition, an important component of the analysis here will be the potential earnings of military personnel after retirement from military service. It is important to understand from the start that the comparison is not behavioral in any sense. Thus, for example, there is no analysis of compensating differentials or any discussion of the compensation package that the military must offer to recruit personnel. Also, it is not possible to make precise comparisons of potential earnings of identical individuals in the military versus the private sector. The comparisons must be taken only as indications of the order of magnitude of earnings potential in the two sectors. Some sensitivity analysis is undertaken to determine the effect on the comparisons of one assumption, however. Section 2.1 compares age-compensation profiles of persons in the military with those in the civilian sector. The general conclusion is that the military pension provisions mean that total compensation from a career in the military would typically be much higher than total compensation in the civilian sector. Section 2.2 considers the retirement wealth of persons in the two sectors. The typical pension wealth of persons who follow a career in the military would at age sixty-two be two to three times as great as the pension wealth of persons who stayed in the civilian sector. Finally, section 2.3 compares military pension accrual profiles with separation rates from the military. Again, the

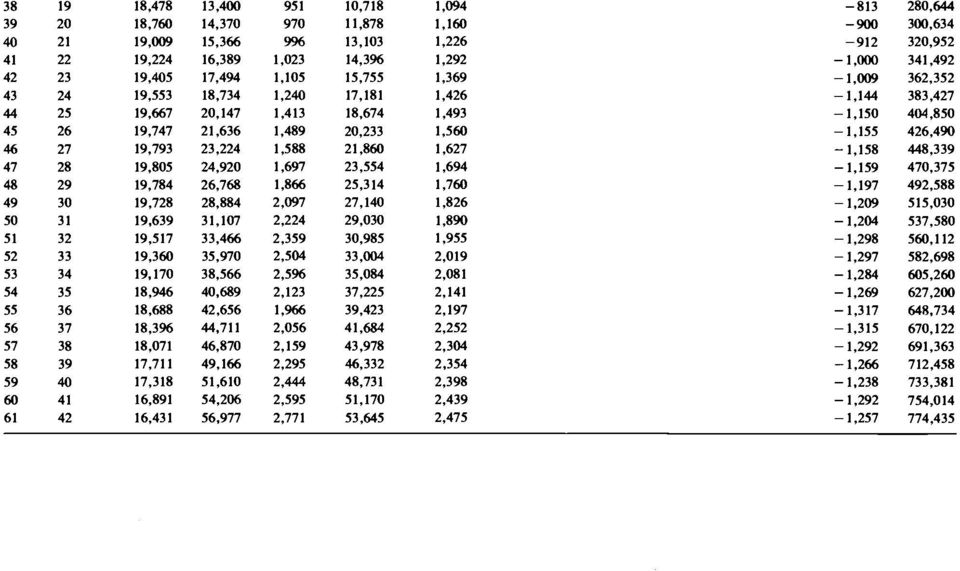
4 21 Military versus Civilian Pay analysis is descriptive but is intended to suggest the results that would be obtained from more detailed behavioral analysis that will be undertaken in future work. 2.1 Age-Compensation Profiles in the Military and Civilian Sectors In this section the procedure followed to develop age-compensation profiles in the civilian sector is discussed first, illustrating the idea for high school graduates. Then the procedure is extended to account for compensation of persons who follow a career in the military, using the career path of a typical enlisted person for illustration. Finally, compensation profiles and total compensation for the two groups are compared Civilian Age-Compensation Profiles The components of compensation are presented in table 2.1 for high school graduates. To facilitate comparison with a survey of the earnings of retired military personnel, all monetary values are in 1978 constant dollars. Column (1) is based on 1978 current population survey data on the earnings of full-time employees. The estimates are based on a simple regression that includes age, age squared, tenure on the current job, tenure squared, and an age-tenure interaction term. The relevant parameter estimates are shown in table 2.A. 1. Tenure on the current job is included to facilitate calculation of private pension benefit accruals which are typically based on years of service in a given job. The salary figures that are shown are based on the assumption that high school graduates begin work at age twenty and stay with the same employer until age sixty-two. Of course this is an unrealistic assumption and will be modified in making comparisons presented below. The profile exhibits the usual pattern of increasing real earnings until around the age of fifty, with declining real earnings thereafter. Column (2) shows accrued Social Security benefits, assuming that the receipt of benefits starts at age sixty-two and using a 3 percent real discount rate. The annual change in accrued Social Security benefits is shown in column (3). Accrued private pension wealth is shown in column (4). These figures are based on the provisions of a typical defined benefit pension plan.* Annual accruals are shown in column (5).3 The columns (6-8) pertaining to military pension benefits and military pension wealth are blank of course in this case. Social Security taxes are shown as negative value^.^ Finally, column (10) shows total cumulated compensation, including pension benefits and Social Security wealth. It can be seen in the last row of the table that typical accrued Social Security wealth at age 61 is $56,977 and that private pension wealth is $53,645. Of

5 Table 2.1 Civilian Age-Compensation Profile, for High School Graduates SS ASS PrvtPens APrvt Military Milita Yrs of Salary Wealth Wealth Wealth Pens Wealth Pension Pens Age Service (1) (2) (3) (4) (5) (6) (7) ,615 8,505 9,362 10,185 10,975 11,730 12,452 13,140 13,794 14,414 15,001 15,554 16,073 16,558 17,010 17,427 17,811 18,161 6,953 7,538 8,146 8,767 9,410 10,071 10,760 11,596 12,449 6, ,136 3,736 4,394 5,111 5,889 6,728 7,629 8,594 9,624 3, ,029

6
7 24 Douglas W. PhillipslDavid A. Wise course not all employees in the private sector are covered by pensions, possibly only 60 percent are Military Age-Compensation Profiles We have no data on average age earnings profiles in the military. Thus for comparison we have selected profiles for several typical career paths. These paths are determined by level of final rank in the service. Regular military compensation is then determined by assuming typical promotion ages and years of service in rank for persons who obtain these final ranks. Four ranks are considered: E6, E7, E8, and E9. They correspond in the army to staff sergeant, sergeant first class, master sergeant, and sergeant major, respectively. Illustrative data for a person who would reach the E8 rank is shown in table 2.2. While mandatory retirement rules are not written in law, they are typically observed but with exceptions, and the mandatory retirement ages vary from service to service. In the army, an E6 if not promoted would typically have to retire after 20 years of service, an E7 after 24 years of service, an E8 after 27 years, and an E9 after 30 years. Table 2.2 assumes that retirement of an E8 occurs at twenty-seven years of service. Thus the salary figures in table 2.2 up to twenty-seven years of service, age 46, are based on regular military compensation schedules. At age 47 the individual is assumed to leave the service, and salary thereafter until age 62 represents estimated potential earnings in the civilian sector, based on a 1977 Department of Defense retiree survey. The estimates are based on the earnings of retirees who were working full time in the civilian sector. Sixty-four percent of retired enlisted personnel and 56 percent of retired officers were working full time at the time of the survey. The earnings of this group seem to be the best indication of the potential earnings of military retirees, although the tendency of those with better earnings possibilities to be more likely to work may exaggerate the average potential earnings of retirees. This self-selection effect has not been accounted for in the empirical results, shown in table 2.A.2 for enlisted personnel and officers separately. The estimation equations include the same variables used to predict the earnings of high school and college graduates in the civilian sector, plus variables that measure years of military service, education, mandatory retirement, and final rank in the military. The initial civilian earnings of retired military personnel are typically lower than final military earnings. Thus for the illustrative retiree in table 2.2, civilian earnings at forty-seven are predicted to be $13,696, while final military salary was $20,724. Civilian earnings then increase, based on the estimates in table 2.A.2, to $18,718 at age sixty-two. Since military personnel are covered by Social Security, the two columns (2, 3) pertaining to Social Security are analogous to those in

8 ~ 205 ~ 556 Table 2.2 Military Age-Compensation Profile, for a Person Who Reaches the Rank of E8 ss A SS F rvt Pens A F rvt Military Military A Military ss Yrs of Salary Wealth Wealth Wealth Pens Wealth Pension Pens Wealth Pens Wealth Tax Total Age Service (1) (2) (3) (4) (5) (6) (7) (8) (9) (10) (continued) 8,444 9,186 10,067 I 1,035 11,035 11,519 11,519 12,599 12,599 12,957 12,957 13,736 14,607 15,127 15,127 15,470 17,442 17,762 17,762 18,119 18,119 6,095 6,680 7,21 I 7,802 8,415 9,045 9,700 10,502 11,321 12,229 13,161 14,117 6, , , , , ,444 17,538 27,504 38,425 49,309 60,668 72,027 84,421 96, , , , , , , , , , , , ,710
 8,444 9,186 10,067 I 1,035 11,035 11,519 11,519 12,599 12,599 12,957 12,957 13,736 14,607 15,127 15,127 15,470 17,442 17,762 17,762 18,119 18,119 6,095 6,680 7,21 I 7,802 8,415 9,045")
9 Table 2.2 (continued) ss ASS Prvt Pens A Prvt Military Military A Military SS Yrs of Salary Wealth Wealth Wealth Pens Wealth Pension Pens Wealth Pens Wealth Tax Total Age Service (1) (2) (3) (4) (5) (6) (7) (8) (9) (10) ,988 18,988 18,988 18,988 20,724 20,724 13,696 14,307 14,879 15,412 15,907 16,362 16,779 17,157 17,497 17,797 18,059 18,282 18,466 18,611 18,718 15,099 16,161 17,357 18,656 20, ,629 23,120 24,733 26,477 28,360 30,393 32,589 34,%9 37,516 39,832 42,284 44,871 47,336 49,836 52,535 55, ,062 1,1% 1,299 1,438 1,535 1,490 1,613 1,744 1,883 2, % 2,370 2,558 2,315 2,452 2,588 2,465 2,500 2,699 2,872 11,016 11,016 11,016 11,016 11,016 11,016 11,016 11,016 11,016 10,195 10,195 11,016 11,914 1,719 11,016 13,787 1,873 11,016 15,823 2,036 11,016 18,031 2,209 11,016 20,425 2,394 11, , , , , , , , , , , , , , , , , , , , , ,322 4,840 4,536 4,223 24,788 3,991 4,091 4,138 4,186 4,234 4,274 4,305 4,338 4,368 4,404 4,434 4,456 4,469 4,486 4,494 4, ,058-1,096-1,124-1,150-1,234-1,272-1,291-1,307-1,320-1,424-1, , , , , , , , , , , , , , , , , , , , ,061 1,016,135

10 27 Military versus Civilian Pay Table 2.1. The military retiree is assumed to take a civilian job with a typical defined benefit pension plan like the one described above. Thus he also accrues private pension wealth as shown in columns (4) and (5) of table 2.2. Columns (6), (7), and (8) pertain to military pension benefits, pension wealth, and accrual rates. Vesting in the military pension system occurs after twenty years of service. Benefits are determined by years of service times 2.5 percent times final military compensation. The benefits are fully indexed for inflation. Thus after twenty years of service a person in the military could retire at 50 percent of his final basic pay indexed to the consumer price index. Benefits are adjusted in March and September of each year. With additional years of service, benefits may increase at 2.5 percent per year to a maximum of 75 percent of basic pay. Only a very small fraction of military personnel are allowed to remain in the service for more than thirty years. After twenty years of service, the value of pension wealth for the illustrative individual in table 2.2 is almost $151,000 (in 1978 dollars). It increases to $213,000 after twenty-seven years, when the person must retire. At that time the person begins to receive benefits of $1 1,000 per year in real dollars. As pension benefits are received, pension wealth falls. But the decline in pension wealth is not as great as the annual benefit, since the decline in pension wealth occurs only because the individual is expected to receive benefits for one less year, but this year is the last year of life and thus the discounted value of benefits in this year is relatively small. Finally, column (10) shows total cumulated compensation. From the last row of the table, it can be seen that at age sixty-one this person has accrued $55,408 in Social Security wealth, $20,425 in private pension benefits, and $147,618 in military pension wealth Military and Civilian Compensation Compared While one might argue that the compensation of persons who remain in the military should be compared with the compensation of civilians who remain in the same firm, the typical experience of military personnel were they to have followed a career in the civilian sector would not be a lifetime career with the same firm. It would not be the expected alternative. One might also argue that the appropriate civilian comparison should be with persons in large firms, but that also would not represent the typical career opportunity of military personnel were they to follow instead a career in the civilian sector. There probably is no single correct comparison. We will maintain the comparison with the average high school graduate and the average college graduate, over all jobs and in firms of all sizes. We rely primarily on figures that are based on the assumption that persons in the civilian sector have two

11 ~ 28 Douglas W. Phillips/David A. Wise job changes, at ages twenty-nine and forty-five, but comparisons assuming no job change in the civilian sector are also presented. It may have been more appropriate to consider simple age-earnings profiles without correcting for job tenure, but as mentioned above tenure is an important determinant of private pension benefits. Thus this procedure has been followed for convenience. Cumulative age compensation profiles of four types of enlisted personnel are compared with the age-compensation profile of the typical high school graduate in figure 2.1, assuming that the high school graduate changes jobs twice. Notice that average civilian compensation essentially matches military compensation during the first twenty years of employment. This is what one might expect if indeed regular military compensation is indexed to civilian earnings. After twenty years of service, however, the value of the military pension leads to a large jump in military compensation. By age sixty-two, potential cumulative compensation following a career in the military is much higher than accrued compensation in the civilian sector. A comparable graph for three officer ranks, compared with civilian college graduates, is shown in figure 2.2. The officer ranks are 04, 05, and, 06, corresponding to major, lieutenant colonel, and colonel respectively. In this case, our predicted civilian compensation is somewhat lower than military compensation even before twenty years of employment. In part this may result because the average job of military Fig. 2.1 I I I I I I I I AGE Comparison of cumulative earnings and pension wealth among four types of enlisted men and a high school graduate who changes jobs two times.

12 29 Military versus Civilian Pay 1,750,000 I I I I I I I I I AGE Fig. 2.2 Comparison of cumulative earnings and pension wealth among three types of officers and a civilian college graduate who changes jobs two times. officers, matched to comparable jobs in the federal civil service, and in turn matched to jobs in the civilian sector, are associated with higher salaries than the average job in the civilian sector. While evidence in Crane and Wise (1984) suggests that military enlisted personnel may be similar with respect to academic aptitude and other measures of individual characteristics to the average high school graduate, the ability of military officers may on average be greater than that of the average college graduate. The average academic aptitude, for example, of persons entering the military academies is higher than that of the average college entrant, suggesting that the average military officer if he were in the private sector might have a better-paying job than the average college graduate in the civilian sector. The job change assumption in the civilian sector may of course lead to lower predicted earnings than the ideal comparison would mandate. Comparable graphs assuming no job change in the civilian sector are shown in figures 2.3 and 2.4 respectively. These comparisons surely overstate compensation in the civilian sector. Some additional information on the components of earnings in the military and civilian sectors are shown in figures 2.5 and 2.6. The bottom line in figure 2.5 represents the earnings of an officer who reaches the 04 rank and takes a job in the civilian sector after twenty years of service. The second line up shows salary earnings plus changes in military pension wealth which are negative after retirement. The top line is the latter amount plus private pension benefits and Social Se-
 suggests that military enlisted personnel may be similar with respect to academic aptitude and other measures of individual characteristics to the average high")
13 30 Douglas W. Phillips/David A. Wise 1,200,000 I I I I I I Key: d ,wO Fig L 20 I I I I I I I AGE Comparison of cumulative earnings and pension wealth among four types of enlisted men and a civilian high school graduate. 1,750,030 I I I I I I I I E 1,250,000 i ' ; I,o~,ooo AGE Fig. 2.4 Comparison of cumulative earnings and pension wealth among three types of officers and a civilian college graduate. curity accruals, less Social Security taxes. The comparable information for a college graduate who remains in the same firm throughout his working life is shown in figure 2.6. The bottom line in this figure represents salary, and the second line salary plus private pension wealth. The difference between the two is small but grows continuously until

14 31 Military versus Civilian Pay l,wo,ocq In 0.f IMnlKYl Key: 0 Salary + Salary +Mil. Pension Salary +Mil. Pension + Priv. Pension + SS /' w 'I-""'-"-! 750,000 i ' 500,000 Fig. 2.5 O t L 20 -"ppp 25 AGE Comparison of cumulative salary, cumulative salary plus military pension wealth, and total cumulative earnings of an officer who reaches rank 04 at retirement. 1,200,ooo I I I I I, I 1, ~ 4 - N Key Cum Salary + Cum Salary + Priv. Pension - Total Cum. Earninqs c 1 AGE Fig. 2.6 Comparison of cumulative salary, cumulative salary plus private pension wealth, and total cumulative earnings of a typical college graduate.

15 ~ 32 Douglas W. Phill$s/David A. Wise age sixty-two. The top line adds Social Security wealth less Social Security taxes. Total cumulated compensation following military versus civilian careers is shown in table 2.3. If one assumes two job changes in the civilian sector, these comparisons suggest that the cumulated compensation at age sixty-two of career enlisted personnel with a subsequent civilian job would be 1.35 to 1.68 times the compensation of the typical high school graduate. The total compensation of career officers who assume civilian jobs upon retirement from the military would be 1.61 to 1.93 times the total compensation of college graduates, depending upon military rank attained. If the comparison is with civilians who stay with the same employer throughout their working lives, the ratios are 1.14 to 1.42 for military enlisted personnel and from 1.36 to 1.63 for officers, depending on military rank attained. Thus while these numbers are far from exact, they suggest that the potential compen- Table 2.3 Rank at Retirement or Education Level Total Lifetime Compensation of Military Personnel and Civilians, by Job Change Assumption, 1978 dollars ~~ Total Compensation Total as Percent of Compensation Civilian Total Two Job Changes in the Civilian Sector Enlisted E6 881, E7 939, E8 1,016, E9 1,096,754 I.68 High school grads 774,435 1.oo Officers 04 1,395, ,506, ,673,291 I.93 College grads 865,649 1.oo No Job Change in the Civilian Sector Enlisted E6 E7 E8 E9 High school grads Officers College grads 881, ,519 1,016,135 1,096, ,435 1,395,374 1,506,846 1,673,291 1,023, oo oo

16 33 Military versus Civilian Pay sation associated with a military career is substantially greater than the compensation that might be expected in the civilian sector. 2.2 Pension Wealth from Military and Civilian Careers The pension wealth of military personnel after twenty years of service is shown in table 2.4. Before twenty years of service, accrued pension wealth is zero; then it jumps at twenty years of service to between $1 17,000 and $151,000 for enlisted personnel, depending on rank, and from $260,000 to $277,000 for officers. These amounts are typically between 50 percent and 60 percent of total earnings during the first twenty years of service. In comparison, the typical high school graduate with a pension plan described above would have $1 1,878 in accrued pension wealth after working twenty years. A typical college graduate would have $19,135. These numbers pertain to civilian workers who remain with the same employer for twenty years. Possibly a better comparison is with a civilian whose earnings are equal to the salary earnings of a person in the military. While a military enlisted person who ultimately would attain the rank of E9 would have accrued pension wealth after twenty years of service of $150,955, a person in the civilian sector with the same salary profile and who did not change jobs would have $1 1,343 after working twenty years. The E9 when he leaves the military after thirty years of service would have $249,320 in pension wealth. A person in the civilian sector with the same salary profile would have $27,111 in pension wealth after thirty years of employment. Suppose that the value of the pension twenty years hence were known and understood by potential enlistees. Then the present value of pension wealth twenty years hence could be considered an enlistment bonus. Suppose that once one enlists one is never forced to leave the Table 2.4 Military Pension Wealth at Vesting, by Rank at Retirement, for Selected Officer and Enlisted Ranks Rank at Retirement Enlisted E6 E7 E8 EY Officer Pension Wealth at Vesting 117, , , , , ,520 Pension Wealth as Percent of Cumulated Salary at Vesting

17 34 Douglas W. Phillips/David A. Wise service before twenty years, although voluntary separations occur. Then the pension could be considered a sure thing if one chose to remain in the service, and foregoing this future pension wealth would be part of the opportunity cost of leaving the military service. For an enlisted person who would ultimately reach the rank of E9, the value of this bonus at enlistment would be $83,302, with future pension wealth discounted at 3 percent. For an officer who would reach the rank 06, the value of the pension at enlistment would be $152,082. These seem like large amounts to pass up were they known. But as mentioned above, pension benefits seem not to be emphasized in public recruitment efforts. In addition, of course, it may be that a 3 percent discount rate does not capture well individual rates of time preference. Estimated rates are often much higher. It is also possible that the compensating differential necessary to entice people to join the military is very large. Subsequent discussion seems to make clear that future pension wealth is highly valued by individuals that have been in the service for five years or more. It is likely that personnel who are in the service are well aware of the value of future pension benefits. Possibly more interesting than retirement wealth after twenty years of employment is retirement wealth at the age when retirement from the labor force is typically considered. Public and private pension wealth at age sixty-two of persons following a military career, compared with pension wealth of high school and college graduates, is shown in table 2.5. Annual benefits from these pension sources are shown in table 2.6. At age sixty-two the pension wealth of career enlisted personnel ranges from $157,000 to $258,000, as compared with $1 11,000 for the typical high school graduate. Pension wealth of officers at this age ranges from Table 2.5 Public and Private Pension Wealth at Age Sixty-Two of Military Enlisted Men and Officers and of High School and College Graduates Rank at Retirement or Social Security Private Pension Military Pension Education Level Wealth Wealth Wealth Total Enlisted rank E6 E7 E8 E9 High school grads Officer rank College grads 55,903 55,875 55,408 56,376 56,977 57,844 57,844 57,844 57,844 29,451 25,154 20,425 17,631 53,645 37,719 23,483-77,624 72, , , , , , , , , , , , , , , ,468

18 35 Military versus Civilian Pay Table 2.6 Annual Public and Private Pension Benefits at Age Sixty-Two of Enlisted Men and Officers and of High School and College Graduates Rank at Retirement or Social Private Military Education Level Security Pension Pension Total Enlisted rank E6 E7 E8 E9 High school grads Officer rank College grads 4,518 4,508 4,470 4,548 4,597 4,667 4,667 4,667 4,667 3,627 3,098 2,515 2,171 4,004 4,645 2,892 5,793 5,382 7,834 11,016 13,707 12,532 17,923 25,353 13,519 15,439 18,001 20,427 8,604 21,844 25,483 30,020 10,460 $263,000 to $398,000 for the three ranks we have considered, compared with $135,000 for the typical college graduate. Thus, potential pension wealth at age sixty-two is two to three times as high for military careerists as for comparable civilians. Social Security wealth is about the same for military personnel as for civilians, and there is little difference in Social Security wealth among the military ranks considered. Private pension wealth is approximately twice as high for civilians as for military careerists. But this difference is swamped by the value of the military pension. Of course by age sixty-two, former military personnel could have been collecting pension benefits for twenty years or more. All of these comparisons assume no job change in the civilian sector. This of course, exaggerates to a substantial degree the value of pension wealth in the civilian sector (Kotlikoff and Wise 1983, 1984). Annual pension benefits shown in table 2.6 reveal comparable differences between the military and private sector, with military total benefits two to three times as high as benefits from a civilian career. 2.3 Increments to Military Pension Wealth and Retirement The military has maintained the need for a young, vigorous armed force. This goal has been reflected in mandatory retirement rules for at least a century. To recruit and retain personnel in light of the mandatory retirement rules, with historically low salaries, in the face of hardship assignments, and in the face of limited postmilitary employment opportunities, it was argued that a generous pension system was necessary.

19 36 Douglas W. Phillips/David A. Wise The pension system has also been used to induce early retirement. The need for an early retirement policy became evident during the Spanish-American and Civil wars when a large number of older officers prevented the military forces from operating effectively. This led to legislation in 1861 that authorized voluntary retirement after 40 years of service and mandatory retirement at 45 years.5 Legislation in 1908 increased the requirement for voluntary retirement to 30 years of service.6 In 1938 the required number of years of service to receive a pension was reduced to the current 20 years. Legislation in 1925 established the military pension benefits for an individual with 30 years of service at the current 75 percent of basic pay; it was argued that these generous retirement provisions were necessary because military retirees often had few other outside sources of income.8 The typical officer, it was argued, lost contact with family and friends, and with private sector employment opportunities, when he entered the military. Thus the pension was often his sole source of income. Legislation authorizing generous retirement benefits also recognized that military service entails unusual conditions of hardship, danger, and restrictions on personal liberty. Thus, it was argued, military employees should be rewarded in old age with a pension that is more generous than a private sector pen~ion.~ Until 1967, military wages were substantially lower than wages in the private sector. Hence it has been argued that the military relied on the pension system to attract personnel. The legislation of 1945, which established the basic framework of the officers pension system, was established to maximize the number of volunteers to replace World War I1 retirees.1 Whether these reasons remain compelling today is open to question. The percentage of ground combat and general duty occupations have decreased significantly over the past ninety years, while the percentage of white-collar jobs has increased. A recent survey of military retirees by the General Accounting Office found that current retirees had spent a small fraction of their total months of service in combat related occupations (Government Accounting Office 1978,lO- 11, Appendixes VI, V). As the military service has become more like a private sector job, the need for extra compensation for military service is less clear. While a military retiree may have had few civilian employment opportunities in the past, it seems evident that that is not true today. Over half find private sector employment after retirement from the military services. All are eligible for Social Security benefits, and many also receive private pensions. And, while salaries in the military may have been much lower than those in the private sector, the earlier evidence demonstrates that that is not true today. Indeed, as mentioned previously, under the federal Pay Comparability Act of 1967 salary levels are set to be much more in line with those in the private sector, man-

20 37 Military versus Civilian Pay dating that military wages be indexed to wage increases in the federal civil service, which in turn are indexed to wages in the private sector." With this background and the stated goals of the pension system in mind, we consider the apparent relationship between separation rates from the armed forces and the pension system. Does it serve to retain personnel for some number of years, say to capture returns on training costs, and then to encourage retirement? Does the system seem to have a differential impact on some groups versus others, for example, those who are doing well in the service versus those who are doing less well? The goal here is not to assess the effects in a formal way, but rather to highlight the apparent major incentive effect of the pension system. We have already demonstrated the large increase in pension wealth at twenty years of service. But the salary structure also formalizes large increases in pay at twenty-three and twenty-six years of service. These salary increases induce large jumps in pension wealth at these years as well. To see this, in table 2.7 pension wealth accruals by year of service are shown for an enlisted man who reaches the rank of E9 and for an officer who reaches the 06 rank. Both must retire after thirty years of service. At twenty-three years of service, pension wealth jumps by about 16 percent for both the officer and the enlisted man. The increase at twenty-six years of service is 12 percent for the enlisted person and about 11 percent for the officer. There is also a larger than usual increase at twenty-two years of service. This pattern is reflected in the accruals for other ranks as well, as long as mandatory retirement does not occur before these years. Table 2.7 Pension Wealth Accrual by Years of Service for an Enlisted E9 and an Officer 06 Enlisted Person Who Officer Who Reaches Rank E9 Reaches Rank 06 Years of Change in Percent Change in Percent Service Pension Wealth Change Pension Wealth Change ,955 5,133 14,322 28,321 5,143 4,788 25,159 4,470 4,075 3,679 3, ,520 8,929 18,560 48,694 8,479 7,817 39,017 7,021 6,277 5,538 4,

21 38 Douglas W. PhillipslDavid A. Wise Total separation rates for all reasons are shown in figure 2.7 for officers and in figure 2.8 for enlisted personnel, by years of service. The graphs show the proportion of people who are in the service after a given number of years who leave the service during the following year. They show hazard rates in more formal terminology. The reasons for separation include active-duty release, nondisability retirement, disability retirement, death, and all other reasons. Active-duty release means separation after completing a term of enlistment. It includes both voluntary and involuntary separations, a distinction that is often ambiguous. We have not yet obtained these data for persons in the service less than five years. It is clear from the graphs that among persons who have been in the service for at least five years, the probability of leaving declines continuously until nineteen years of service. It is small throughout the period. The data is consistent with the hypothesis that as the value of the future pension wealth increases because the length of time to its availability is shorter, individuals are increasingly less likely to forego the pension to accept a job in the civilian sector. Thirty-two percent of officers who are still in the service leave after twenty years, while fully 50 percent of enlisted personnel leave after twenty years. Thereafter, there is a substantial drop in average separation rates. This pattern, of course, is what one would expect if one viewed military compensation in the form of a lifetime budget constraint with a shape similar to that in figures 2.1 through 2.4. Years of Service Fig. 2.7 Average military separation rates by years of service for officers, Source: Defense Manpower Data Center.
22 39 Military versus Civilian Pay I I,, Fig. 2.8 Average separation rates for enlisted personnel, Source: Defense Manpower Data Center. These figures are averages across all men in the military and make no distinctions among individuals. One might expect that whether an individual left the military would depend on current rank and expected promotion in the military versus expected alternative income in a civilian job. While doing well in the military might encourage one to stay there, it might also indicate greater ability than the average person in the military and therefore relatively better opportunities in the civilian sector, and thus a greater likelihood of leaving the military. On the other hand, persons doing poorly in the military may find it unappealing for the future, but doing poorly in the military may indicate that opportunities in the civilian sector are not good either. Thus it is not clear what relationship one should observe between performance in the military and separation rates. The empirically observed rates by rank are shown in table 2.8 for enlisted personnel and in table 2.9 for officers. Again, these rates pertain to total separations and make no distinction among the possible reasons for leaving. The heavy horizontal lines indicate mandatory retirement years by rank in the army. They are only suggestive because these limits vary by military service. In addition, while a person who is for example, an E5 after twelve years of service would presumably have to leave at 13 years of service if he were not promoted, he could be promoted in the interim and thus not be forced to leave. Horizontal dashed lines are drawn at the twenty-year vesting period and at the two points of relatively large salary increases, twenty-three and twenty-
23 40 Douglas W. PhillipslDavid A. Wise Table 2.8 Total Separation Rates by Rank and Years of Service for Enlisted Personnel, Average Rank Years of Service E1-E3 E4 E5 E6 E7 E8 E ,364, ,360,325,340,284,313,212,175,202,198,233,215,201,180,222.I85.I64,177,145,120,136,113,126.I 16,135.I 14.I I16,101,079,082, ,056,102, ,104,086,079,056, ,035, , ,127, , ,634,784,717,480., , ,374.,418,453,557,499,603, , , , ,407, , ,160,144.I 14,115,099, ,041,035,032, _ ,351,316 -,293,306, , ,700,183,078.I88,186.I65, , ,100,061,181,066,089,066,101,049,093, ,037,039,036,034, , , ,257,202,222,188,197, , , ,202, , six years of service. The blanks in the table occur where there were fewer than twenty-five observations. Even in other cells pertaining to high ranks with few years of service or to low ranks with relatively many years of service, the number of observations may be quite small. Thus the lower left triangle of the table and the upper right triangle may be anomalous. Enlisted personnel at the lowest ranks have the highest separation rates for all years before pension vesting at twenty years of service. The El through E3 group has higher separation rates than the E4 group, and this latter group in turn has higher separation rates than the E5 group, for virtually every year of service category.i2 Persons at the E5 level are more likely to leave than persons at the E6 level in each year of service category. In part, of course, this reflects the up-or-out rule. For each rank there is a large jump in the separation rate at the vesting age. But the rate at this age declines continuously from a high
24 41 Military versus Civilian Pay Table 2.9 Total Separation Rates by Rank and Years of Service, for Officers, Average Rank Years of Service , , I56.I ,124.I30.I10,169,036,119,115,107,141. I32,020,088,075,094,139,143,028,079, ,116, , ,109,017, ,050,107, ,046, ,104.I20, , , ,008,020, , ,049,107,045,025,050,002,030, ,024,048,028,026, ,015,027, ,041,030,009, _.029 -,032 -,017 - _ ---, _ ,079, ,528, ,041,106, , , ,225,297,185, ,094, ,214.lo1,066,087,205,291,201, ,068.I56,225, ,172,185,260,246.I80,078,187,246, s 1.200,247 -, ,079,211,314, ,104,606,617, ,136,388, ,270 of 80 percent for persons at the E4 rank to a low of 24 percent for those at the E9 level. Thereafter the pattern is similar, with higher ranking persons less likely to leave. Thus the pattern for enlisted personnel suggests that persons who have moved most quickly through the ranks are least likely to leave the military. The only noticeable exception is revealed in the upper right-hand portion of the table; it shows relatively high separation rates for persons who have moved very quickly through the ranks. For example, the separation rate for persons at the E9 level after seven years of service is 23 percent, while it is about 10 percent for persons at the E6 level after seven years of service. For the highest three ranks there appears to be a large increase in the separation rates between twenty-five and twenty-six years of service. Remaining in the service from twenty-five to twenty-six years increases the value of the pension by a substantial amount, while in-
25 42 Douglas W. Phillips/David A. Wise creases thereafter are relatively small. This possible effect does not seem evident between twenty-two and twenty-three years of service, however. While these separation rates cannot tell us how many of those who remain after twenty years of service will remain until the mandatory retirement age, because the data do not allow one to follow the same individuals over time, the data do suggest that almost no one who is not promoted would remain in the service until the mandatory retirement age. For example, of those at rank E7 who remain in the service at twenty years, only about 32 percent would still be in the service after twenty-three years, according to the figures in the column E7. Only about 23 percent of those at the E8 level would remain until mandatory retirement at twenty-six years were they not promoted. Thus the pension provisions seem to provide a strong incentive to retire, at least if the inducement of currently available benefits is not offset by increases in pension wealth that would result from apromotion were one to remain in the service. Separation rates for officers are shown in table 2.9 by rank and years of service. Compared with enlisted personnel, for officers the relationship between rank and separation rates seems much less pronounced. Considering only persons in ranks 03 through 06, with less than twenty years of service, there is little relationship between rank and rate of separation, although a sharp eye might see a tendency for the separation rates to be higher for higher-ranking officers with few years of service, and a reversal of this tendency as years of service approach twenty. After the vesting age, however, it seems clear that separation rates are considerably lower for higher-ranking officers. For example, at twenty years of service the separation rates range from a high of.53 for those at the 04 level to a low of.22 for those at the 06 level. This pattern persists among those with more years of service. For example, approximately 27 percent of those at the 04 level leave at twenty-three years of service while only 11 percent of those at the 06 rank leave at twenty-three years. Again, it seems apparent that the available pension benefits provide a strong inducement to leave the service. For example, only about 30 percent of officers who remained in the service at twenty years at the 04 level would stay until the age of mandatory retirement at twentyfour years were they not promoted. Fewer than 23 percent of officers who were in the service after twenty years at the 06 level would remain until the age of mandatory retirement at thirty years of service were they not promoted in the interim. In short, there is a strong incentive for both officers and enlisted personnel to retire at twenty years of service, an incentive that provides a much greater effective inducement for persons at lower than at higher
26 43 Military versus Civilian Pay ranks. Even after twenty years of service, foregone pension benefits seem to weigh heavily against remaining in the service, if the foregone benefits are not offset by increased pension wealth (and salary) resulting from promotions in the service. 2.4 Summary Potential compensation from a military career is considerably larger than typical enlisted personnel and officers would receive if they were to follow a lifetime career in the civilian sector. Total potential lifetime compensation of enlisted careerists according to our preferred estimates is between 1.35 and 1.68 times the average lifetime compensation of high school graduates, depending on military rank achieved. Total potential compensation of officers is between 1.61 and 1.93 times the lifetime compensation of the average college graduate, according to our preferred comparison. Because of ambiguity about the correct comparison to make, the figures cannot be considered precise, but we believe they reflect realistic orders of magnitude. Much of the difference between military and civilian compensation is due to the very generous military pension system. The public and private pension wealth at age sixty-two of career enlisted personnel would be between 1.5 to 2.5 times the pension wealth of the typical high school graduate with a private pension. Career officers at sixtytwo would have two to three times the public and private pension wealth of a typical college graduate with a private pension. Summary descriptive data suggest that the military pension system provides a strong inducement for those with five or more years of service to remain for twenty years when pension benefits are available. After that, available pension benefits apparently provide a strong incentive to retire if foregone benefits are not offset by promotions in the service and the resulting increase in pension wealth. Behavioral analysis of the effects of military versus civilian compensation on enlistment and separation rates will be the subject of future work.
27 44 Douglas W. Phillips/David A. Wise Appendix Table Z.A.l. Estimated Parameters of Civilian Earnings Profiles, Based on 1978 Current Population Survey Data, by Education Level Variable High School Graduates College Graduates Constant Age Age squared Tenure Tenure squared Age x tenure R2 3, , (655.02) (2,332.48) , (38.53) (129.52) (0.52) (1.68) (49.96) (150.08) (1.10) (3.13) (1.31) (4.02) N 10,203 3,525 Nore: Numbers in parentheses are standard errors. Table Z.A.2 Estimated Parameter of Civilian Earnings Profiles of Retired Military Personnel, for Enlisted Personnel and Officers Enlisted Variable Personnel Officers Constant 23, ,786. I (14,214.6) (23,299.2) Age ,948.2 (606.1) (894.6) Age squared (7.0) (8.4) Tenure (213.4) (315.7) Tenure squared (11.5) (17.8) Years of service (145.9) ( 127.2) Race (1,228.2) (4,045.O) Education High School Some college ( ) (I,230.3) (
28 45 Military versus Civilian Pay Table 2.A.2 Variable (continued) Enlisted Personnel Officers B.A. degree 4, ,095.3 (1,865.5) (1,283.1) Grad. degree 7, ,344.7 (2,600.4) (1,376.9) Mandatory retirement 1, ,211.5 (704.3) (870.7) Rank E6 2, (1,228.3) E7 3, (1,229.9) E8 4, (1,384.4) E9 6, (1,677.5) 05-2,412.6 (1,091.3) 06-5,496.7 (1,441.7) 07 or higher - 13,415.7 (3,911.2) R2,066.I06 N Note: Numbers in parentheses are standard errors. Notes The computations for this chapter were completed by Maria Hanratty, and most of the historical information in the first part of section 2.3 is taken from her 1984 paper. 1. For a detailed description of regular military compensation, see Binkin See also Dept. of Defense, Benefits are given by.01 x years of service x average earnings in the last five years of employment. The plan is assumed to have ten-year cliff vesting and early retirement at age fifty-five, and to limit credited years of service to thirty. The early retirement benefit reduction is assumed to be 3 percent. For a detailed discussion of the characteristics of private pension benefits, see Kotlikoff and Wise 1983 and Private pension benefit accruals are calculated assuming a 3 percent real discount rate and 6 percent price inflation. The later figure is important in assessing the value of early retirement benefits. 4. Social Security figures are based on 1978 provisions. 5. Act of August 3, 1861, 12 Stat. 287.
Volume URL: http://www.nber.org/books/feld87-2. Chapter Title: Individual Retirement Accounts and Saving
 This PDF is a selection from an out-of-print volume from the National Bureau of Economic Research Volume Title: Taxes and Capital Formation Volume Author/Editor: Martin Feldstein, ed. Volume Publisher:
REPORT TO THE CONGRESS
 REPORT TO THE CONGRESS Cost and Impact on Recruiting and Retention of Providing Thrift Savings Plan Matching Contributions OFFICE OF THE SECRETARY OF DEFENSE February 2010 Table of Contents I. Introduction...
Volume URL: http://www.nber.org/books/wise94-1. Chapter Author: Robin L. Lumsdaine, James H. Stock, David A. Wise
 This PDF is a selection from an out-of-print volume from the National Bureau of Economic Research Volume Title: Studies in the Economics of Aging Volume Author/Editor: David A. Wise, editor Volume Publisher:
Social Security Eligibility and the Labor Supply of Elderly Immigrants. George J. Borjas Harvard University and National Bureau of Economic Research
 Social Security Eligibility and the Labor Supply of Elderly Immigrants George J. Borjas Harvard University and National Bureau of Economic Research Updated for the 9th Annual Joint Conference of the Retirement
Volume Title: Aging Issues in the United States and Japan. Volume URL: http://www.nber.org/books/ogur01-1
 This PDF is a selection from an out-of-print volume from the National Bureau of Economic Research Volume Title: Aging Issues in the United States and Japan Volume Author/Editor: Seiritsu Ogura, Toshiaki
CRS Report for Congress
 Order Code RL30631 CRS Report for Congress Received through the CRS Web Retirement Benefits for Members of Congress Updated January 21, 2005 Patrick J. Purcell Specialist in Social Legislation Domestic
A Guide to the Pension Options
 A Guide to the Pension Options James A. Chalfant and Helen L. Henry 1 Explanatory note: the purpose of this document is to go beyond the requests for tables showing simple, hypothetical results for new
Retirement Benefits for Members of Congress
 Katelin P. Isaacs Analyst in Income Security July 31, 2015 Congressional Research Service 7-5700 www.crs.gov RL30631 Summary Prior to 1984, neither federal civil service employees nor Members of Congress
Calculating Railroad Retirement Employee Annuities - Benefit Information
 Calculating Railroad Retirement Employee Annuities - Benefit Information Many railroad workers and annuitants want to know how their railroad retirement benefits are calculated. The following describes
SIEPR policy brief. Efficient Retirement Design. By John B. Shoven. About The Author. Stanford University March 2013
 Stanford University March 2013 Stanford Institute for Economic Policy Research on the web: http://siepr.stanford.edu Efficient Retirement Design By John B. Shoven The pension system in the U.S. has changed
The McClatchy Company. Retirement Plan. April 1, 2009 SUMMARY PLAN DESCRIPTION. April 1, 2009. Table of Contents. Rev. 08/10
 The McClatchy Company Retirement Plan April 1, 2009 SUMMARY PLAN DESCRIPTION April 1, 2009 Table of Contents Rev. 08/10 Table of Contents I. INTRODUCTION... 4 PLAN HIGHLIGHTS... 5 II. LEGACY MCCLATCHY
How To Calculate The Total Product Of An Economic System
 This PDF is a selection from an out-of-print volume from the National Bureau of Economic Research Volume Title: The Measurement of Saving, Investment, and Wealth Volume Author/Editor: Robert E. Lipsey
Retirement incomes. Aisur. Submission to the Tax White Paper Task Force. July 2015
 Retirement incomes Submission to the Tax White Paper Task Force July 2015 Executive summary 2015 1 Background The Australian retirement income system comprises three pillars: a publicly funded means tested
John Keel, CPA State Auditor. A Report on State Employee Benefits as a Percentage of Total Compensation. April 2014 Report No.
 John Keel, CPA State Auditor A Report on State Employee Benefits as a Percentage of Total Compensation Report No. 14-704 A Report on State Employee Benefits as a Percentage of Total Compensation Overall
FACULTY RETIREMENT PLANS: THE ROLE OF RETIREE HEALTH INSURANCE
 TRENDS AND ISSUES SEPTEMBER 2015 FACULTY RETIREMENT PLANS: THE ROLE OF RETIREE HEALTH INSURANCE Robert L. Clark Zelnak Professor Poole College of Management North Carolina State University Retiree health
How To Cost The Federal Government $19.6 Billion For Health Care Benefits To Early Retirees
 DataWatch The Cost Of Providing Health Care Benefits To Early Retirees by Paul Fronstin, Sara C. Snider, William S. Custer, and Dallas L. Salisbury Abstract: Subsidized health care benefits would be guaranteed
COMPANY ANNUITY PLANS AND FEDERAL OLD-AGE INSURANCE
 COMPANY ANNUITY PLANS AND FEDERAL OLD-AGE INSURANCE M. B. FoLsoM* Old-Age Assistance Strong arguments can be made for providing pensions in a systematic way to aged persons who have no means of subsistence.
T H E P U B L I C P E N S I O N P R O J E C T. Can California Teacher Pensions Be Distributed More Fairly?
 T H E P U B L I C P E N S I O N P R O J E C T RESEARCH REPORT Can California Teacher Pensions Be Distributed More Fairly? Richard W. Johnson Benjamin G. Southgate December 2014 ABOUT THE URBAN INSTITUTE
Employers costs for total benefits grew
 Costs Benefit Costs Comparing benefit costs for full- and part-time workers Health insurance appears to be the only benefit representing a true quasi-fixed cost to employers, meaning that the cost per
AAFES Retirement Plan
 for Eligible Civilian Employees of the Army & Air Force Exchange Service i A027000 (March 2008) The information contained in this booklet explains and illustrates your Retirement Plan. The terms and conditions
West Virginia Department of Public Safety Death, Disability and Retirement Fund (Plan A)
") West Virginia Department of Public Safety Death, Disability and Retirement Fund (Plan A) Actuarial Valuation As of July 1, 2013 Prepared by: for the West Virginia Consolidated Public Retirement Board January
West Virginia Department of Public Safety Death, Disability and Retirement Fund (Plan A) Actuarial Valuation As of July 1, 2013 Prepared by: for the West Virginia Consolidated Public Retirement Board January
This PDF is a selection from a published volume from the National Bureau of Economic Research
 This PDF is a selection from a published volume from the National Bureau of Economic Research Volume Title: Fiscal Policy and Management in East Asia, NBER-EASE, Volume 16 Volume Author/Editor: Takatoshi
Chapter X. Costing Labor Contracts
 Chapter X Costing Labor Contracts It is regrettable but possibly inevitable that the negotiation process will be, at least in some measure, adversarial. Labor seeks to maximize its gain and government
Military and Civilian Compensation: How Do They Compare?
 Military and Civilian Compensation: How Do They Compare? James E. Grefer with David Gregory Erin M. Rebhan Executive summary Background Every 4 years, the Department of Defense (DOD) conducts a review
The GPO predominantly penalizes women educators in California, while the WEP penalizes many individuals who switch careers into public service.
 Chair Pomeroy and Members, Social Security has met the social insurance promise to ensure workers will not have to live in old age poverty. This promise needs to be guaranteed for current and future workers.
EFFECTS OF PENSIONS ON LABOR MARKETS AND RETIREMENT. Robert L. Clark College of Management North Carolina State University. and
 EFFECTS OF PENSIONS ON LABOR MARKETS AND RETIREMENT by Robert L. Clark College of Management North Carolina State University and Joseph F. Quinn Department of Economics Boston College presented at ERISA
STATE COLLEGE FACULTY COMPENSATION LAW Act of Jan. 18, (1952) 1951, P.L. 2111, No. 600 Cl. 24 AN ACT
 1951, P.L. 2111, No. 600 Cl. 24 AN ACT") STATE COLLEGE FACULTY COMPENSATION LAW Act of Jan. 18, (1952) 1951, P.L. 2111, No. 600 Cl. 24 AN ACT To provide for minimum compensation and increments for administrators and members of the faculty of
STATE COLLEGE FACULTY COMPENSATION LAW Act of Jan. 18, (1952) 1951, P.L. 2111, No. 600 Cl. 24 AN ACT To provide for minimum compensation and increments for administrators and members of the faculty of
May 2015. Missing out: How much employer 401(k) matching contributions do employees leave on the table?
 matching contributions do employees leave on the table?") May 2015 Missing out: How much employer 401(k) matching contributions do employees leave on the table? Table of contents Introduction Executive summary 1 Role of employer 401(k) matching contributions
May 2015 Missing out: How much employer 401(k) matching contributions do employees leave on the table? Table of contents Introduction Executive summary 1 Role of employer 401(k) matching contributions
U.S. ARMY NAF EMPLOYEE RETIREMENT PLAN
 U.S. ARMY NAF EMPLOYEE RETIREMENT PLAN March 2014 INTRODUCTION This booklet is published by the U.S. Army NAF Employee Benefits Office. It is intended to provide you with useful information about the U.S.
John Keel, CPA State Auditor. A Report on State Employee Benefits as a Percentage of Total Compensation. February 2010 Report No.
 John Keel, CPA State Auditor A Report on State Employee Benefits as a Percentage of Total Compensation Report No. 10-704 A Report on State Employee Benefits as a Percentage of Total Compensation Overall
SOCIAL SECURITY PROGRAMS AND RETIREMENT AROUND THE WORLD
 SOCIAL SECURITY PROGRAMS AND RETIREMENT AROUND THE WORLD by Jonathan Gruber and David Wise based on papers by Pierre Pestieau and Jean-Philippe Stijns, Belgium Jonathan Gruber, Canada Didier Blanchet and
It Pays to Stay (Figure 1)
") It Pays to Stay (Figure 1) In Missouri, as in other states, teachers who leave early, or move elsewhere, fare poorly in pension benefits compared to those who stay. Notes: Teacher enters at age 25 and
It Pays to Stay (Figure 1) In Missouri, as in other states, teachers who leave early, or move elsewhere, fare poorly in pension benefits compared to those who stay. Notes: Teacher enters at age 25 and
ICI RESEARCH PERSPECTIVE
 ICI RESEARCH PERSPECTIVE 0 H STREET, NW, SUITE 00 WASHINGTON, DC 000 0-6-800 WWW.ICI.ORG OCTOBER 0 VOL. 0, NO. 7 WHAT S INSIDE Introduction Decline in the Share of Workers Covered by Private-Sector DB
INVESTMENT COMPANY INSTITUTE
 INVESTMENT COMPANY INSTITUTE PERSPECTIVE Vol. 6 / No. 1 January 2000 Perspective is a series of occasional papers published by the Investment Company Institute, the national association of the American
FRBSF ECONOMIC LETTER
 FRBSF ECONOMIC LETTER 2014-13 May 5, 2014 Is It Still Worth Going to College? BY MARY C. DALY AND LEILA BENGALI Earning a four-year college degree remains a worthwhile investment for the average student.
Earnings of Youths. 6 Military Service and Civilian. Jon R. Crane and David A. Wise
 6 Military Service and Civilian Earnings of Youths Jon R. Crane and David A. Wise The largest single employer of American youths is the United States military. While the proportion of youths serving in
PENSION PLAN GUIDE GOVERNING PENSION LAW
 PENSION PLAN GUIDE GOVERNING PENSION LAW The pension plan was established by an Act of the 45th Legislature of the State of Texas, which met in 1937. The fund was created by state statute article 6243e
Comprehensive Business Budgeting
 Management Accounting 137 Comprehensive Business Budgeting Goals and Objectives Profit planning, commonly called master budgeting or comprehensive business budgeting, is one of the more important techniques
Research perspective. A Look at Private-Sector Retirement Plan Income After ERISA. Key Findings
 Research perspective 1401 H Street, NW, Suite 1200 Washington, DC 20005 202/326-5800 www.ici.org November 2010 Vol. 16, No. 2 A Look at Private-Sector Retirement Plan Income After ERISA Key Findings Retirement
New Estimates of the Private Rate of Return to University Education in Australia*
 New Estimates of the Private Rate of Return to University Education in Australia* Jeff Borland Department of Economics and Melbourne Institute of Applied Economic and Social Research The University of
PRELIMINARY ANALYSIS OF RETIREMENT PROGRAMS FOR PERSONNEL IN THE MINISTRY OF THE ARMED FORCES AND MINISTRY OF INTERIOR OF THE REPUBLIC OF CUBA
 PRELIMINARY ANALYSIS OF RETIREMENT PROGRAMS FOR PERSONNEL IN THE MINISTRY OF THE ARMED FORCES AND MINISTRY OF INTERIOR OF THE REPUBLIC OF CUBA Ricardo Donate-Armada Law-Decrees 101 and 102 of the Republic
Over the past 30 years, there has been a fundamental change
 The shift from defined benefit pensions to 401(k) plans and the pension assets of the baby boom cohort James Poterba*, Steven Venti, and David A. Wise *Department of Economics, Massachusetts Institute
Policy: Military Leave
 Policy: Military Leave Policy Statement CITATION REFERENCE Official Title: Military Leave Policy Abbreviated Title: Military Policy Volume: CCGA Policies Responsible Office: Human Resources Department
PENSIONS AT A GLANCE 2009: RETIREMENT INCOME SYSTEMS IN OECD COUNTRIES UNITED STATES
 PENSIONS AT A GLANCE 29: RETIREMENT INCOME SYSTEMS IN OECD COUNTRIES Online Country Profiles, including personal income tax and social security contributions UNITED STATES United States: pension system
MetLife Retirement Income. A Survey of Pre-Retiree Knowledge of Financial Retirement Issues
 MetLife Retirement Income IQ Study A Survey of Pre-Retiree Knowledge of Financial Retirement Issues June, 2008 The MetLife Mature Market Institute Established in 1997, the Mature Market Institute (MMI)
Table of Contents. Background and Certification Page 2 Introduction Page 3. Amortization Method Page 4
 Racine County School Office Accounting and Sample Funding Report of Liabilities for Participants Post Employment Benefits as of January 1, 2011 Thru End of the Year December 31, 2011 January 2012 This
OVERVIEW OF CURRENT SCHOOL ADMINISTRATORS
 Chapter Three OVERVIEW OF CURRENT SCHOOL ADMINISTRATORS The first step in understanding the careers of school administrators is to describe the numbers and characteristics of those currently filling these
Minnesota Judicial State Court Salaries
 Minnesota Judicial State Court Salaries Prepared for the Minnesota District Judges Association by Karine S. Moe, Ph.D. F.R. Bigelow Professor of Economics Chair, Department of Economics Macalester College
The Tax Benefits and Revenue Costs of Tax Deferral
 The Tax Benefits and Revenue Costs of Tax Deferral Copyright 2012 by the Investment Company Institute. All rights reserved. Suggested citation: Brady, Peter. 2012. The Tax Benefits and Revenue Costs of
Saving and Life Insurance Holdings at Boston University A Unique Case Study
 Saving and Life Insurance Holdings at Boston University A Unique Case Study by B. Douglas Bernheim Stanford University and National Bureau of Economic Research bernheim@stanford.edu Solange Berstein Boston
SUMMARY OF FERS AND CSRS
 Appendix A SUMMARY OF FERS AND CSRS This appendix summarizes the main features of FERS and CSRS (Office of Personnel Management, 1998). FERS FERS became effective on January 1, 1987. Most employees who
Use this update notice to find out about changes, which were published in the Postal Bulletin, that have occurred since the last printed version.
 Update Notice Handbook EL-502, CSRS Retirement Guide February 2005 Handbook EL-502, CSRS Retirement Guide, was last printed in February 2005. To inform you of changes since that time, we periodically update
This PDF is a selection from a published volume from the National Bureau of Economic Research. Volume Title: Perspectives on the Economics of Aging
 This PDF is a selection from a published volume from the National Bureau of Economic Research Volume Title: Perspectives on the Economics of Aging Volume Author/Editor: David A. Wise, editor Volume Publisher:
Lump Sum Alternatives to Current Veterans Disability Compensation
 CRM D0014443.A3/Final November 2006 Lump Sum Alternatives to Current Veterans Disability Compensation Elizabeth Schaefer Eric W. Christensen 4825 Mark Center Drive Alexandria, Virginia 22311-1850 Approved
SOCIAL SECURITY REFORM: work incentives ISSUE BRIEF NO. 6. Issue Brief No. 6. work incentives
 Introduction Issue Brief No. 6 Social Security Reform: work incentives This sixth and final Treasury issue brief on Social Security reform discusses Social Security s effect on work incentives and the
Volume URL: http://www.nber.org/books/wise94-1. Chapter Title: 401(k) Plans and Tax-Deferred Saving. Chapter Author: James M. Poterba, Steven F.
 Plans and Tax-Deferred Saving. Chapter Author: James M. Poterba, Steven F.") This PDF is a selection from an outofprint volume from the National Bureau of Economic Research Volume Title: Studies in the Economics of Aging Volume Author/Editor: David A. Wise, editor Volume Publisher:
This PDF is a selection from an outofprint volume from the National Bureau of Economic Research Volume Title: Studies in the Economics of Aging Volume Author/Editor: David A. Wise, editor Volume Publisher:
WORKING P A P E R. Choices and Information Needs for Workers Leaving the North Carolina State Retirement Plan
 WORKING P A P E R Choices and Information Needs for Workers Leaving the North Carolina State Retirement Plan Accepting a Lump Sum Payment or Receiving an Annuity at Retirement ROBERT CLARK AND MELINDA
center for retirement research
 DO SPOUSES COORDINATE THEIR RETIREMENT DECISIONS By Richard W. Johnson * Introduction The movement of married women into the labor market is transforming retirement behavior. A generation ago, when few
FY10 Illinois Pension Reform Proposals SURS Implications Fact Sheet 5/22/09
 FY10 Illinois Pension Reform Proposals SURS Implications Fact Sheet 5/22/09 Pension reform measures covering all of the State employee retirement systems were initially proposed in the Governor s Fiscal
CITY OF GROSSE POINTS FARMS SUMMARY OF ORDINANCE NO. 386 ENTITLED AN ORDINANCE TO AMEND AND RESTATE THE PROVISIONS OF THE CITY OF GROSSE POINTE FARMS
 CITY OF GROSSE POINTS FARMS SUMMARY OF ORDINANCE NO. 386 ENTITLED AN ORDINANCE TO AMEND AND RESTATE THE PROVISIONS OF THE CITY OF GROSSE POINTE FARMS PUBLIC SAFETY OFFICER RETIREMENT SYSTEM TO INCORPORATE
Social Security Retirement Parman R. Green, MU Extension Ag Business Mgmt. Specialist
 Social Security Retirement Parman R. Green, MU Extension Ag Business Mgmt. Specialist Farmers and many other self-employed business owners who report income on the cash-basis have a tremendous amount of
Issue: Veterans Home Loan Program
 Issue: Veterans Home Loan Program Resolution No. 95, 101 2009 National Convention, 351, 354, 355, 359 2008 National Convention. The American Legion supports efforts to eliminate employment barriers that
CANADA POST CORPORATION REGISTERED PENSION PLAN EFFECTIVE OCTOBER 1, 2000
 CANADA POST CORPORATION REGISTERED PENSION PLAN EFFECTIVE OCTOBER 1, 2000 Revised and approved by the Pension Committee of the Board of Directors of on November 21, 2013 CANADA POST CORPORATION REGISTERED
Personal Accounts and Social Security Reform
 Preliminary Draft Retirement, Saving, Benefit Claiming and Solvency under a Partial System of Voluntary Personal Accounts Alan L. Gustman Dartmouth College and NBER and Thomas Steinmeier Texas Tech University
SESSION OF 1963. Act Nos. 180-181-182 329
 SESSION OF 1963. Act Nos. 180-181-182 329 authorities fixing the tax rate for any year at a mill rate need include a statement expressing the rate of taxation in dollars and cents on each one hundred dollars
Warwick Public School System
 Warwick Public School System Actuarial Valuation Post Employment Benefits Other Than Pensions as of July 1, 2011 under Governmental Accounting Standards Board Statement No. 45 (GASB 45) (Estimated Disclosures
Determining Future Success of College Students
 Determining Future Success of College Students PAUL OEHRLEIN I. Introduction The years that students spend in college are perhaps the most influential years on the rest of their lives. College students
May 5, 1998 I. CHARACTERISTICS OF MULTIEMPLOYER PLANS
 TESTIMONY OF THE NATIONAL COORDINATING COMMITTEE FOR MULTIEMPLOYER PLANS BEFORE THE COMMITTEE ON WAYS AND MEANS SUBCOMMITTEE ON OVERSIGHT ON PENSION ISSUES The National Coordinating Committee for Multiemployer
A User s Guide to Indicator A9: Incentives to Invest in Education
 A User s Guide to Indicator A9: Incentives to Invest in Education Indicator A9 on incentives to invest in education brings together available information on educational investments and the benefits that
New Comparability Plan: A New Paradigm in Retirement Planning for Small- Business Owners by Keith R. Fevurly, CFP, J.D., LL.M.
 New Comparability Plan: A New Paradigm in Retirement Planning for Small- Business Owners by Keith R. Fevurly, CFP, J.D., LL.M. Executive Summary A profitable, closely held small-business owner not only
Should You Retire at Age 62 or at 65?
 Should You Retire at Age 62 or at 65? Craig M. Newmark, 1 North Carolina State University Michael Walden, 2 North Carolina State University Retiring at age 62 allow pensions and Social Security payments
RBH No. 8712 1 STATE OF OKLAHOMA. 2nd Session of the 53rd Legislature (2012) AS INTRODUCED
 AS INTRODUCED") RBH No. STATE OF OKLAHOMA nd Session of the rd Legislature () HOUSE BILL AS INTRODUCED By: Holland An Act relating to public retirement systems; amending O.S., Section -00, which relates to the Oklahoma
RBH No. STATE OF OKLAHOMA nd Session of the rd Legislature () HOUSE BILL AS INTRODUCED By: Holland An Act relating to public retirement systems; amending O.S., Section -00, which relates to the Oklahoma
Introduction. Chapter 13. Michael Hansen Diana Lien
 Chapter 13 Compensation and Voluntary Participation in a Continuum of Service Michael Hansen Diana Lien Introduction Since the end of the cold war, and after September 11, 2001 in particular, the U.S.
PENSION MATHEMATICS with Numerical Illustrations
 PENSION MATHEMATICS with Numerical Illustrations Second Edition Howard E. Winklevoss, Ph.D., MAAA, EA President Winklevoss Consultants, Inc. Published by Pension Research Council Wharton School of the
Retirement Income Effects of Changing theincometaxtreatmentofdc Pension Plans
 Retirement Income Effects of Changing theincometaxtreatmentofdc Pension Plans Martin Holmer, Policy Simulation Group May 14, 2012 Abstract This paper presents estimates of the after-tax retirement income
Attention: Michelle Schulz, Finance Director. The date of the valuation was December 31, 2014. The purpose of the actuarial valuation is to:
 March 2, 2015 The Board of Trustees Retiree Health Care Trust Fund, Michigan 48326-2753 Attention: Michelle Schulz, Finance Director This report contains the results of an actuarial valuation of the liabilities
Seasonal Workers Under the Minnesota Unemployment Compensation Law
 Seasonal Workers Under the Minnesota Unemployment Compensation Law EDWARD F. MEDLEY* THE PAYMENT of unemployment benefits to seasonal has raised practical and theoretical problems since unemployment compensation
Individual Account Retirement Plans: An Analysis of the 2010 Survey of Consumer Finances
 September 2012 No. 375 Individual Account Retirement Plans: An Analysis of the 2010 Survey of Consumer Finances By Craig Copeland, Ph.D., Employee Benefit Research Institute A T A G L A N C E The share
Retirement System. IRS Compliance Policy I\5165269.7
 Retirement System IRS Compliance Policy August 2015 Table of Contents I. SECTION 1. PUBLIC EMPLOYEES RETIREMENT SYSTEM TIERS 1, 2, AND 3 DEFINED BENEFIT PLAN...2 A. Rollover Distributions Compliance with
Methodology For Calculating Damages in the Victim Compensation Fund
 Methodology For Calculating Damages in the Victim Compensation Fund The calculation of presumed economic loss will generally follow the guidelines established in the original VCF. The Special Master will
Retirement Plan for Bargaining Unit Employees of Florida Progress Corporation
 Document title: AUTHORIZED COPY Retirement Plan for Bargaining Unit Employees of Florida Progress Corporation Document number: HRI-PGNF-00013 Applies to: Keywords: Progress Energy Florida, Inc. (bargaining
Pension Regulation for the Public Service Employees Chapter One General Provisions The basis Article One: Objectives Article Two:
 Pension Regulation for the Public Service Employees Chapter One General Provisions The basis Article One: This regulation has been enacted pursuant to the paragraph (3) of article 29 of the Civil servant
CSRS Creditable Military Service FERS Chapter 22
 CSRS Creditable Military Service FERS i Table of Contents Subchapter 22A CSRS Part 22A1 General Information Section 22A1.1-1 Overview... 1 A. Introduction... 1 B. Topics Covered... 1 C. Organization of
Board of Education Retirement System of the City of New York BRIEF SUMMARY TIER 6
 BERS Board of Education Retirement System of the City of New York BRIEF SUMMARY TIER 6 Effective April 1, 2012 New York City Board of Education Retirement System Tier 4 Revised Plan Also known as Tier
Trends in Higher Education Series. Trends in College Pricing
 Trends in Higher Education Series Trends in College Pricing 2006 Introduction This report, based on the College Board s Annual Survey of Colleges, provides up-to-date information on tuition and other expenses
UNIFORMED SERVICES EMPLOYMENT AND REEMPLOYMENT RIGHTS ACT (USERRA) TRAINING. Report Tile UNITED STATES OFFICE OF PERSONNEL MANAGEMENT
 TRAINING. Report Tile UNITED STATES OFFICE OF PERSONNEL MANAGEMENT") UNIFORMED SERVICES EMPLOYMENT AND REEMPLOYMENT RIGHTS ACT (USERRA) TRAINING Report Tile UNITED STATES OFFICE OF PERSONNEL MANAGEMENT Overview Uniformed Services Employment and Reemployment Rights Act (USERRA)
UNIFORMED SERVICES EMPLOYMENT AND REEMPLOYMENT RIGHTS ACT (USERRA) TRAINING Report Tile UNITED STATES OFFICE OF PERSONNEL MANAGEMENT Overview Uniformed Services Employment and Reemployment Rights Act (USERRA)
COMPARISON OF PAY AND BENEFITS ELIGIBILITY FOR ACTIVE-DUTY PERSONNEL AND NATIONAL GUARD AND RESERVE PERSONNEL ON ACTIVE DUTY
 COMPARISO OF PA AD BEEFITS ELIGIBILIT FOR ACTIVE-DUT PERSOEL AD ATIOAL GUARD AD RESERVE PERSOEL O ACTIVE DUT A Report Prepared by the Federal Research Division, Library of Congress under an Interagency
61.702 Group hospital and medical insurance and managed care plan coverage -- Employee and employer contributions -- Minimum service requirements.
 61.702 Group hospital and medical insurance and managed care plan coverage -- Employee and employer contributions -- Minimum service requirements. (1) (a) 1. The board of trustees of Kentucky Retirement
Methodology. MINT Model
 Social Security Issue Paper Poverty-level Annuitization Requirements in Social Security Proposals Incorporating Personal Retirement Accounts No. 2005-01 April 2005 In the current discussions of Social
Working Beyond Retirement-Age
 Working Beyond Retirement-Age Kelly A. Holder and Sandra L. Clark U.S. Census Bureau Housing and Household Economics Division Labor Force Statistics Branch Presented at the American Sociological Association
Accurately and Efficiently Measuring Individual Account Credit Risk On Existing Portfolios
 Accurately and Efficiently Measuring Individual Account Credit Risk On Existing Portfolios By: Michael Banasiak & By: Daniel Tantum, Ph.D. What Are Statistical Based Behavior Scoring Models And How Are
Civil Servant and Teacher Insurance Act
 Civil Servant and Teacher Insurance Act Article 1 This Act is enacted in order to provide security of the lives of civil servants and teachers, and to process the insurance of civil servants and teachers
HAS THE RETURN TO INVESTING IN A COLLEGE EDUCATION DECLINED?
 HAS THE RETURN TO INVESTING IN A COLLEGE EDUCATION DECLINED? December 2013 Kent Hill, Ph.D. Research Professor, Department of Economics; and Principal Research Economist, L. William Seidman Research Institute
Employees Retirement System (ERS) Old Plan, New Plan, GSEPS Plan Guide E RSGA. Employees Retirement System of Georgia. Serving those who serve Georgia
 Old Plan, New Plan, GSEPS Plan Guide E RSGA. Employees Retirement System of Georgia. Serving those who serve Georgia") Employees Retirement System (ERS) Old Plan, New Plan, GSEPS Plan Guide Serving those who serve Georgia E RSGA Employees Retirement System of Georgia Updated 09/2013 Table of Contents Introduction... 3
Employees Retirement System (ERS) Old Plan, New Plan, GSEPS Plan Guide Serving those who serve Georgia E RSGA Employees Retirement System of Georgia Updated 09/2013 Table of Contents Introduction... 3
Volume Publisher: University of Chicago Press. Volume URL: http://www.nber.org/books/hall82-1. Chapter URL: http://www.nber.org/chapters/c11455
 This PDF is a selection from an out-of-print volume from the National Bureau of Economic Research Volume Title: Inflation: Causes and Effects Volume Author/Editor: Robert E. Hall Volume Publisher: University
Your Pension Benefits from The City of Atlanta and The Atlanta Board of Education
 Rev. 12/05 Your Pension Benefits from The City of Atlanta and The Atlanta Board of Education Summary Plan Description for the General Employees Pension Plan Police Officer s Pension Plan Firefighter s
Request to Remain in the CORP. Return to Work after Retirement
 CRECTIONS OFFICER RETIREMENT PLAN 3010 East Camelback Road, Suite 200 Phoenix, Arizona 85016-4416 www.psprs.com Telephone: (602) 255-5575 Fax: (602) 255-5572 9/2012 SUMMARY OF BENEFITS Summary Topics Average
The Georgia Lottery Corporation. Analysis of Sales, Proceeds, and Incentive Pay. Who we are
 Special Examination 11-02 March 2011 Why we did this review The Senate Appropriations Committee requested this special examination of the Georgia Lottery Corporation (GLC). The Committee specifically requested
INSTRUCTIONS TO CANDIDATES
 Society of Actuaries Canadian Institute of Actuaries Exam MLC Models for Life Contingencies Friday, October 31, 2014 8:30 a.m. 12:45 p.m. MLC General Instructions 1. Write your candidate number here. Your
What is a Pension Equity Plan?
 What is a Pension Equity Plan? by L. Bernard Green Originally Posted:October 29, 2003 To meet the needs of workers who hold a number of jobs throughout their lives, employers continue to seek new kinds