update Energy Fuel Distribution Transport
|
|
|
- Bernard Arnold
- 8 years ago
- Views:
Transcription
1 Energy Fuel Distribution Public Transport Airports March 21, Issue No. 31 update In April Infratil and the New Zealand Superannuation Fund are purchasing Shell s New Zealand fuel distribution business and 17.1% interest in the New Zealand Refining Company for $696.5 million. This Update outlines the transaction and provides a detailed description of the industry and the business being acquired. The investment is attractive because SNZ is in a structurally attractive industry. It is expected to deliver good returns to Infratil shareholders. Shell New Zealand Fuel & Chemical Distribution SNZ purchases crude and refined fuels and chemicals in the international market, has the crude refined and distributes the refined products to individual and commercial customers throughout New Zealand. Each year SNZ distributes approximately 2.5 billion litres or 3% of New Zealand s total fuel requirements, and earns an average net margin of about 5 to 6 cents per litre. The business comprises the infrastructure required for this supply chain and the associated working capital. Infratil s Investment Infratil has purchased 5% of the SNZ business and 5% of the 17.1% interest in the New Zealand Refining Company. Infratil is to pay $21 million. The other 5% is being acquired by the New Zealand Superannuation Fund. Additional funding is being provided by banks. The purchase is being undertaken through a holding company. Since 31 March 29 Infratil has realised $393 million from the sale of assets and businesses and has invested approximately $45 million either internally or in new businesses such as SNZ. Following the SNZ investment Infratil s net debt will be approximately $1,2 million, down from $1,21 million at 31 March 29. The divestment and investment transactions were undertaken with the simple objective of improving the returns to Infratil s shareholders in the economic and financial environment which is expected over the medium term. To give a sense of scale to the activity, approximately 8% of Infratil s assets are unchanged over the year. When deciding to invest in SNZ it was recognised that an alternative application of the funds was a return of capital to Infratil shareholders through a share buy back or immediately higher dividend. In the very short term it is possible that buying back Infratil shares could lift the Infratil share price more than investing in SNZ, but for the 9-95% of shareholders who are still holding their shares in a year s time, management believe that the SNZ transaction will be more rewarding. In any case, Infratil s financial circumstances and the robust cash flow of SNZ means that Infratil s shareholders can reasonably anticipate increased cash returns. The price negotiated by Infratil s management for SNZ is believed to be a favourable reflection of the difficult financial market and the vendor s strategic decision to exit from these activities. SNZ is the largest supplier of motor fuels to the New Zealand market and the company has good prospects of earnings growth. The fuel distribution business in New Zealand is undergoing change. It has been dominated by four major oil companies (Shell, BP, Caltex, Mobil) for over a generation and both Shell and Mobil have now either exited or have signalled an intention to exit. New owners will bring differences of approach and perspective. Local ownership of the SNZ fuels distribution business has considerable potential to be good for New Zealand and to result in a better managed more successful company. There are advantages when head office and owners are on their customers doorstep.

2 The New Zealand Motor-Fuel Industry Fuel sales in New Zealand amount to approximately 8.5 billion litres per annum, sourced roughly 6 billion litres through the Marsden Point Refinery and 2.5 billion litres as imported refined product. Each of the four major fuel distribution companies (SNZ, BP, Caltex, Mobil) purchases crude and distillate feedstock for processing by the Refinery for which they are charged a fee set from an international refinery benchmark. New Zealand s incremental fuel needs are imported as processed products, again mainly by the four major fuel companies. Half of the Refinery output is piped to Wiri in Auckland with most of the remainder distributed by road tankers to local markets or by coastal tankers around New Zealand. There are port facilities to unload and store fuel at each of Marsden Point, Wiri/Auckland, Mt Maunganui, New Plymouth, Napier, Wellington, Nelson, Lyttelton, Timaru, Dunedin and Bluff. International imports of refined fuels are also landed at these ports. The four major distribution companies own the two coastal tankers which move fuel between the ports and the relevant handling and storage facilities at each of the depots and ports. At Mt Maunganui Gull Petroleum also has facilities. Fuel is distributed from the ports, in the main, by contracted road transport or relatively short distance pipelines. In order to lower costs, the four major fuel companies have a number of agreements which make parts of their individual storage and distribution facilities available to the other companies. For instance Mobil owns the only pipeline linking Port Lyttelton to Christchurch. The other companies can truck fuel from Lyttelton to Christchurch, but leasing pipe capacity from Mobil gives a lower distribution cost. The New Zealand Automobile Association and Ministry of Economic Development independently monitor the margin between the retail price of petrol and its estimated landed cost, including taxes and international freight. The MED calculation of the margin is shown in the graph at the bottom of this page. The average is about 15 cents per litre with a day-to-day range of as much as +/- 1 cents. This is the gross margin between the estimated imported cost of fuel and the pump price. The net margin of a company such as SNZ also reflects the cost of distributing the fuel within New Zealand. The net margin for SNZ has averaged about 5 to 6 cents per litre over the last five years. It would be possible for a new entrant fuel distribution company to build port, storage and distribution facilities, but in addition to the cost of construction, the new company would also have to manage the risks associated with fluctuating oil and fuel prices and the need to fund inventory. Supermarkets, which sell fuel now, source that fuel from one of the existing distribution companies, presumably because it is cheaper and lower risk than developing their own distribution channels. In other markets, such as Australia and the UK, supermarkets have expanded into fuel retailing in competition with fuel distribution companies. They have been able to do this because plentiful local sources of supply (whether from independent importers or refineries) have meant they could compete with traditional fuel companies. These supply options are not readily available in New Zealand and it is notable that even in Australia the situation has changed with the number of independent traders declining markedly over recent years (from 7, companies in the 197s to 12 in 28). 35 Fuel Distribution Company Gross Margin - Regular Petrol (one week lag) 3 25 cents per litre Jan 8 Apr 8 Jul 8 Oct 8 Jan 9 Apr 9 Jul 9 Oct 9 Jan 1 Long-term average Source: Ministry of Economic Development 2

3 3,5 New Zealand Demand for Motor-Fuels 3, Annual Consumption (million litres) 2,5 2, 1,5 NZ Petrol Demand and Projected Demand MED forecast petrol demand, upper and lower bounds 1, New Zealand Consumption of Diesel (litres) New Zealand Consumption of Diesel (litres) NZ Pump Price of 95 Octane Petrol ($) Total fuel demand in New Zealand has been relatively stable despite the recession and, at times, very high prices. It is widely anticipated that in future hydrocarbon based fuels will become more expensive and vehicles will become more efficient and maybe even electric or hydrogen powered. The viability of electric vehicles is demonstrated in Wellington which has electric trolley buses. Nevertheless, New Zealand demand for diesel and petrol is not expected to fall substantially for several decades. The Ministry of Economic Development forecasts are graphed at right. They are approximately in-line with the forecasts developed for Infratil in its assessment of the value of SNZ. The notable trends over the period to 225 are an expected gradual decline in petrol demand and increasing use of diesel. Diesel use is rising because private motorists are switching from petrol and because commercial transport, and its associated fuel demand, grows in line with the economy as goods have to be moved. Annual Consumption (million litres) NZ Diesel Demand and Projected Demand 14. 4, 12. MED forecast petrol demand, upper and lower bounds 1. 3,5 8. 3, ,5 2. 2, , NZ Pump Price of 95 Octane Petrol ($) 1, NZ Petrol Demand and Projected Demand Annual Consumption (million litres) US$ fee per barrel of oil processed 3,5 MED forecast petrol demand, upper and lower bounds NZ Refining Gross Margin and Operating Profit 3, 12 2,5 1 2,8 6 1,5 4 1, NZRC operating surplus GRM US$/bbl NZRC Operating Surplus High Forecast Low Forecast New Zealand Consumption of Diesel (litres) 35 3 NZ Pump Price of 95 Octane Petrol 3

4 SNZ SNZ s operations and assets comprise all the parts of a business which purchases crude and refined fuels and chemicals from the international market and distributes fuels and chemicals throughout New Zealand. In addition, Infratil and the New Zealand Superannuation Fund are buying Shell s 17.1% shareholding in the New Zealand Refining Company. Procurement & Inventory Each year SNZ purchases approximately 1,75 million litres of crude oil and 75 million litres of refined product. The crude oil is delivered to the New Zealand refinery in approximately 15 cargoes of 11 million litres each. Refined product arrives in New Zealand in smaller consignments of 3-4 million litres. SNZ s inventory comprises the crude which has been purchased and loaded on a ship all the way through to the refined fuel in a petrol station storage tank. It fluctuates in quantity between 3 million and 65 million litres worth over $6 million. Refining, National Distribution SHZ has a contract with the Refinery to process crude for a fee determined by reference to an international refinery margin benchmark. Approximately 7% of the fuel distributed by SNZ is processed by the Refinery. Half of the Refinery output is piped 17 kilometres to Wiri in Auckland with most of the remainder distributed nationally by coastal tankers. The Refinery Company owns the pipeline and the Wiri storage facility. SNZ, along with BP, Mobil and Caltex, own the two coastal fuel tankers which deliver refined fuels around New Zealand. Facility Location SNZ BP Caltex Mobil Gull Refinery Coastal tankers Whangarei Auckland Mt Maunganui Napier New Plymouth Wellington Nelson Christchurch Timaru Dunedin Bluff 4

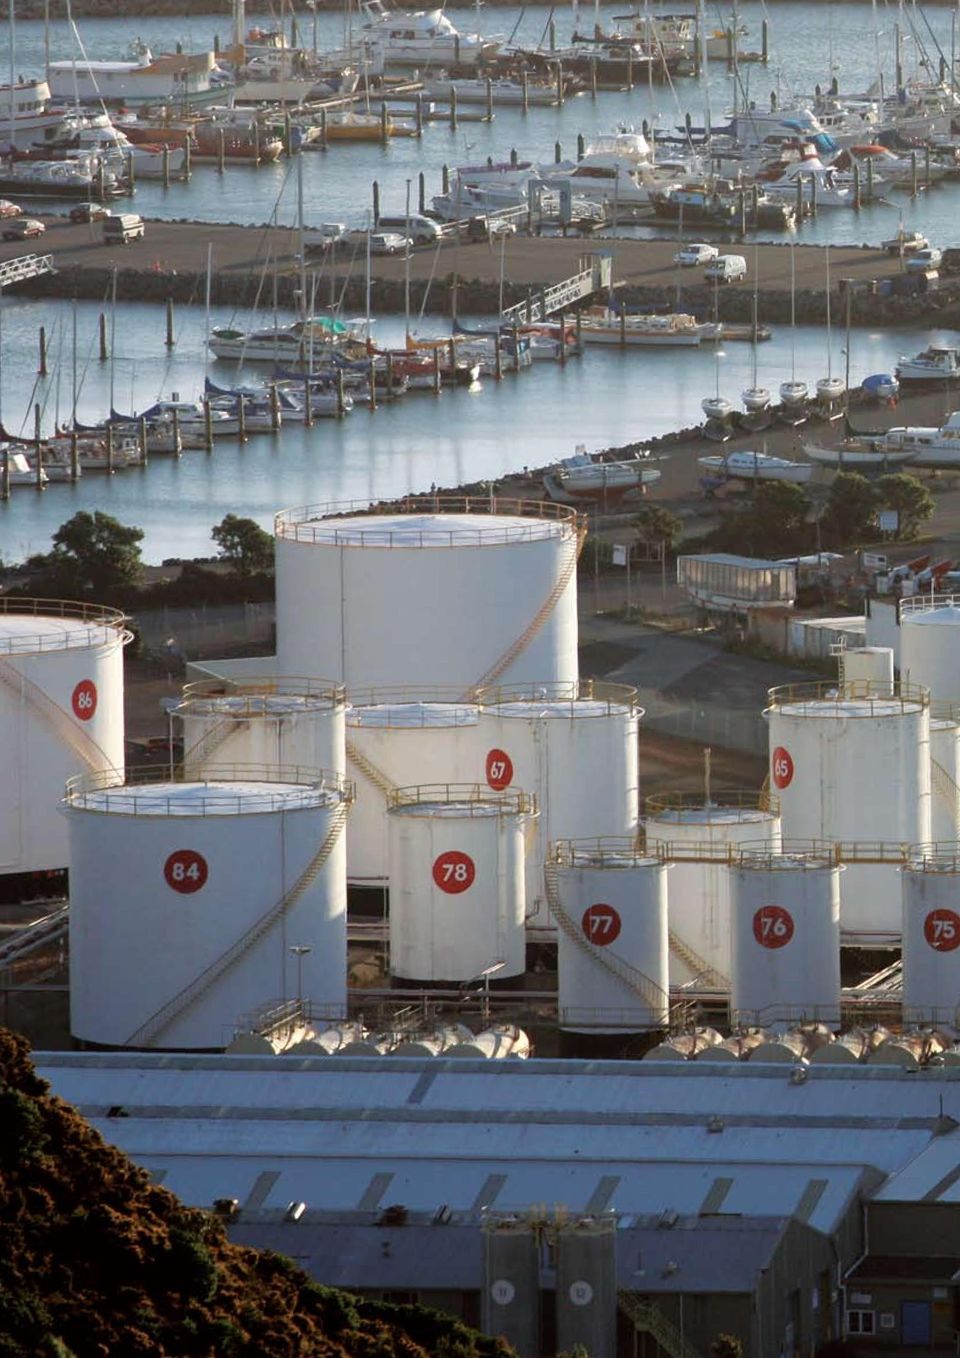
5 Terminals, Storage and Regional Distribution At some terminals each oil company owns storage, while at others storage and facilities may be leased from one company to another. SNZ operates some facilities, while others are operated by joint ventures. These arrangements minimise over-capacity and operational duplication. SNZ distributes from the storage terminals by contracted road haulage to its retail stations and truck-stops and directly to commercial customers. In Auckland jet fuel is delivered to the airport by pipeline. Marine fuels are distributed directly from port storage as well as by road tankers and barges. Retail & Commercial Delivery SNZ has 229 retail service stations of which 111 are owned freehold, 13 are leased and 15 are independent. The service stations are located throughout New Zealand. 7 in Northland/Auckland. 47 in Waikato/Bay of Plenty. 1 in Poverty Bay/Hawkes Bay. 16 in Taranaki/Manawatu. 21 in Wellington. 12 in Nelson/Marlborough. 34 in Canterbury/ West Coast. 19 in Otago/Southland. In addition SNZ has facilities for distributing fuel to commercial users, including 95 truck-stop sites expressly for commercial vehicles. SNZ has leadership in most of the market segments in which it operates and because many of the industry s costs are fixed, its higher volumes mean lower unit costs. The service stations are operated on a franchise model which is explained on page 8. SNZ has storage and distribution facilities at 12 sites. At each terminal facilities vary depending on regional needs for individual products; 91, 95 and 98 octane petrol, diesel, jet fuel, aviation gas, chemicals, fuel oil, etc. Marsden Point Wiri Auckland Mt Maunganui New Plymouth Napier Nelson Wellington Woolston Lyttelton Timaru Dunedin Bluff 5

6 Supply & Refining Approximately 7% of New Zealand s 8.5 billion litres per annum of fuel consumption is sourced from the Marsden Point Refinery. A recent upgrade of the Refinery will lift its output from 6. to 6.6 billion litres or 75% of national demand. Product NZ Consumption Refinery Output Petrol 38% 34-35% Diesel 35% 33-34% Aviation Fuel 18% 19-2% Fuel Oil 7% 1-12% Other 2% 2-3% Contracts between the four major fuel distribution companies and the Refinery mean that the refining fee is set at 7% of an international benchmark with a maximum fee of US$9 per barrel and a minimum of approximately NZ$3 per barrel. During periods of high refining margins, the discount the distribution companies receive under their contracts can amount to up to 3 cents per litre although it is usually approximately 1 cent per litre. At present with refining margins depressed the benefit is minor. However, even when refining margins are low, there are still efficiency advantages and freight savings from using the Refinery as opposed to those in Australia or Asia. The Refinery s processing capacity is allocated between the four companies each calendar year based on their market shares for each product over the previous three years. Based on the capacity allocations each of the four companies must then undertake to provide the Refinery with crude of specified quality at specified times to enable it to achieve its agreed outputs. On average SNZ procures 15 crude cargoes a year of an average 11 million litres (approximately 7, barrels). The following tables show the Refinery s normal types and sources of input. Type of Crude Source of Crude High sulphur crude 41% Middle East 52% Low sulphur crude 37% Asia 24% Condensates 11% New Zealand 14% Residues 11% Australia 5% Other 5% SNZ retains ownership of its oil through the refining process and once it has taken receipt of petrol, diesel, etc from the Refinery it tops up its requirements via direct imports. The average size of an imported cargo of refined product is 3-4 million litres. The New Zealand Refining Company Limited The Refining Company is listed on the NZX and is 17.1% owned by SNZ with other shareholders being BP 24%, Mobil 19%, Caltex 13%, Emerald Capital Holdings 13% and the public 14%. The Refining Company assets comprise the refinery, the 17km pipeline to the Wiri terminal in Auckland and the terminal facilities at Wiri. The Refinery s tolling operation where it refines crude provided by the four distribution companies means it has no requirement to buy and sell product or manage inventory and it can rely on a minimum level of income. However, in keeping with other refineries, its fees are set in an international market and when there is too much capacity, those fees can be low. US$ fee per barrel of oil processed US$ NZ Refining Gross Margin and Operating Profit NZ$ million NZRC operating surplus The graph shows the relationship between the Refinery s profitability and its gross margin. The graph also shows projections of refining margins out to 22. Ultimately actual margins will be a function of refinery supply and demand, both of which are subject to high degrees of uncertainty GRM US$/bbl NZRC Operating Surplus High and Low Forecast GRM 6

7 SNZ Commercial Sales Fuel sales in New Zealand are split approximately 5/5 between retail and commercial users and SNZ s sales are also in the same proportions. Commercial customers are categorised under the headings of Commercial, Aviation, Marine, Chemicals and Bitumen. Commercial sales and distribution mainly involves diesel and encompasses Truck Stops and direct delivery of fuels. The Truck Stops are a national network of un-manned roadside refuelling facilities for commercial vehicles. Direct delivery is by tanker to user sites. The aviation fuel market comprises jet fuel and aviation gasoline, with 8% of the former sourced from the Refinery with the balance, and all aviation gasoline, imported. The supply at each airport tends to be defined by local infrastructure and logistical factors and nationally the market shares of the four suppliers have been reasonably equal and stable for several years. Marine customers are approximately 5/5 international and domestic and are fuelled via specialist port facilities. The primary drivers of market share are price, security of supply, and the access infrastructure. Three fuels (diesel and light and heavy fuel oil) are provided with marine use being the major application of the Refinery s output of fuel oil. Bitumen is a refinery output after more valuable products have been extracted from crude oil and the Refinery is currently changing its operations which may reduce its bitumen production. As approximately 85% of New Zealand s bitumen is used by three road contracting companies, which already undertake direct imports, it is possible that the fuel companies will cease trading this product. SNZ operates a small specialist chemicals business. Unlike its competitors, SNZ is active in all markets and is New Zealand s only comprehensive fuel distribution company. The one exception is with regards to supplying competing retailers which SNZ does not do, whereas BP, for instance, supplies both Foodstuffs and G.A.S. outlets. There are several different approaches to each commercial market which makes for a competitive offering. SNZ tends to deliver to its customers whereas a more come to our depot and pick it up model is available elsewhere. 7

8 SNZ Retail Sales Nationally there are approximately 1,26 retail service stations, of which 1,81 (86%) are one of SNZ, BP, Mobil or Caltex, which distribute about 9% of all retail fuels. Gull Petroleum, established 1998, has 33 sites provided with fuel from its own terminal and storage facilities in Tauranga. Foodstuffs entered the fuel market in 22 and has 34 sites supplied by BP. There are another 114 retail sites which are supplied by the four distribution companies. Almost half of New Zealand s total fuel sales (approximately 4 billion litres), occurs through retail service stations and retail sales also make up about 5% of SNZ s throughput. SNZ s 229 service stations have the industry s highest average fuel throughput due to their good locations, past closure of low throughput sites, high quality fuels, competitive pricing, the FlyBuys loyalty programme and a discount voucher scheme operated with Progressive Enterprises supermarkets. 45% of SNZ s retail sales involve FlyBuys or a supermarket discount. 2% involve the Shell Card. New Zealand s two leading supermarket chains, Foodstuffs and Progressive, each has links with fuel distribution companies which means that a supermarket shopper can use their docket to get a discount on fuel, usually of 4 cents per litre. In Australia, where details of the sharing of the docket-discount are public, 1 cent is borne by the supplying fuel company and 3 cents by the supermarket. These are essentially arrangements to drive business to the relevant supermarkets rather than a way for supermarkets to develop standalone fuel businesses that compete with distributors. Of SNZ s retail stations, 111 are freehold, 13 are leased and 15 are operated under Shell branding by independent dealers. 11 stations have Select Shops (over 1 square metres) and 97 have Shell Shops (6-7 square metres). A small number of stations have sub-leased space to car wash and fast food outlets. Most of SNZ s stations (over 9%) are managed by a contracted retailer who is paid a cents per litre fee on fuel sales and receives a share of the gross margin on non-fuel sales. The contractor employs and pays station staff and is responsible for normal operating costs. None of the retail staff are employed by SNZ. Average annual sales at SNZ s service stations amount to 5.2 million litres of fuel and approximately $1.2 million of shop goods. SNZ is the market leader as regards per site fuel sales with the rest of the industry having average sales of about 2.7 million litres per station. However SNZ s shop sales have been flat over recent years and the potential to do better is illustrated by BP s Wild Bean outlets which are New Zealand s leading coffee distributor. Market Shares While total industry fuel volumes are made public by the Ministry of Economic Development, sales by individual companies are not readily available. However, the Refinery discloses its allocation of capacity and this is a reasonable proxy for market shares and it is known that independents have 4-5% of the total fuels market or about 8-1% of the retail market (their commercial sales are negligible). Company Share of Refinery Output Retail Service Stations Total Market SNZ 3% % BP 28% % Mobil 21% 38 19% Caltex 21% % Other 181 4% 8
, occurs through retail service stations and retail sales also make up about 5% of SNZ s throughput.")
9 Setting the Fuel Price for Consumers The Refinery provides most of New Zealand s fuel needs with residual demand imported as finished product. Studies of New Zealand retail fuel prices show that the prices seen by consumers closely relate to the price of fuels in the international wholesale market. The following graph shows the Ministry of Economic Development s record of the annual average price of regular petrol in New Zealand since 1997 and their calculation of the components of that price, being: The cost of fuel delivered to New Zealand which they calculate from public information on Singapore refinery prices and freight and handling costs. New Zealand taxes. The New Zealand distributor margin, which is calculated by MED as the residual once landed fuel and tax costs have been deducted from the pump price. NZ$ NZ Pump Price of 95 Octane Petrol Landed Cost of Fuel Taxes Distributor s Margin Most of the change in pump prices has come from fluctuations in the imported cost of fuel. Distributors margins have been relatively stable. The following graphs, also from MED, show a weekly calculation of the distributors margin since January 27. The distributor margin shown in the graphs is before any of the distributors costs incurred in taking fuel from the port to the motorist. It has been reasonably stable except for the one sharp dip in mid 27. The landed price of imported fuel seems to be setting the New Zealand pump price, presumably because of how participants in the market compete. Each distribution company knows that its competitors are buying fuel on the international market and will increase purchases and sales if local margins became attractive. On the other hand, there are several reasons why the local market margins are stable and not subject to independent parties buying cargoes of cheap fuel in Singapore and dumping it on the local market. New Zealand fuel is subject to detailed local specifications which means that fuel usually has to be made especially for New Zealand use. It is not practical to just buy a cheap off the shelf cargo in the international market. Any independent party which imported a cargo of fuel would have to arrange storage. A small cargo of 4 million litres would be sufficient for 3-4 service stations for six months. A large commercial diesel user such as NZ Bus (with over 1, buses travelling over 45 million kilometres a year) would take two years to consume one small cargo of imported diesel. A single cargo of fuel which was purchased at one moment and then sold over an extended period of time creates substantial price risk. If market prices fell just after the cargo was purchased the fuel would no longer be relatively cheap and would be sold at a loss. In effect the local market appears to be in equilibrium with prices set by reference to international markets because each distribution company knows that fuel is available to a competitor at that price. However new entrants and one-off cheap deals are not commercially viable at current margins. Ministry figures show that distributors margins (when smoothed out for short term fluctuations) have been reasonably stable since 2. This stability presumably reflects that while the industry s costs will have risen, this must have been off-set by increasing efficiency. An example is the decline in the number of service stations from 3,4 in 198 to 1,265 in 28, which would have substantially lowered the industry costs. The Ministry of Economic Development constantly reviews fuels prices in New Zealand and it has undertaken a number of competition studies. There was also the 21 approval by the Commerce Commission of Mobil s purchase of the Challenge retail fuels operation. In all cases the regulatory agencies found no evidence of collusive behaviour, nor that there were persistent long run barriers to entry. Retail price movement of regular petrol versus landed cost based on Singapore benchmark Regular Petrol Importer margin over time New Zealand cents per litre Mar 7 Sep 7 Mar 8 Sep 8 Mar 9 Sep 9 Mar New Zealand cents per litre New Zealand New cents Zealand per litre cents per litre Regular Petrol Importer margin over time Mar 7 Sep 7 Mar 8 Sep 8 Mar 9 Sep 9 Mar 1 New Zealand retail price of regular petrol (LHS) Landed cost based on Singapore Mogas 95 Unleaded with one week lag (RHS) Source: Ministry of Economic Development Mar 7 Sep 7 Mar 8 Sep 8 Mar 9 Sep 9 Mar 1 Source: Ministry of Economic Development 9

10 SNZ Operational & Financial Data Over the last five years SNZ had stable sales volumes while its net earnings per litre of fuel distributed rose slightly. However, the calculation of earnings depends on which accounting rules are followed; Historic Cost (which uses the cost of fuel sold on a first in, first out basis), or Current Cost (calculated on the basis that as fuel is sold a roughly similar amount will be purchased and a distribution company s income margin should be measured accordingly). International accounting standards require that reported results are shown using Historic Cost, but fuel distribution companies tend to be financially assessed on the basis of Current Cost. On the following page the difference in measurement is further explained. Year Ended 31 December Market Indices Average NZ$/US$ Exchange Rate Crude price at year end (NZ$per barrel) $76.85 $8.95 $ $64.49 $13.76 Average crude price NZ$/bbl $7.15 $94.95 $92.61 $ $95.12 Crude price range NZ$/bbl $49.18 $84.3 $8.95 $ $71.44 $ $64.49 $18.75 $65.13 $ SNZ Operations Sales (million litres) 2,519 2,479 2,538 2,61 2,58 Sourced from Refinery (%) 67% 7% 64% 67% 7% Distributed to retail (%) 49% 5% 49% 47% 5% Inventory at year end (million litres) SNZ Financial (NZ$million) Revenue (excluding tax) $1,788 $2,26 $2,174 $2,942 $2,152 Gross margin $289 $315 $288 $399 $368 Operating costs ($171) ($24) ($28) ($245) ($23) Current Cost EBITDA $118 $111 $8 $154 $138 Stock value adjustment $55 $47 $7 ($16) $38 Historic Cost reported EBITDA $173 $158 $15 ($6) $176 Depreciation ($27) ($23) ($2) ($21) ($22) Capex ($25) ($3) ($33) ($31) ($25) NZRC contribution $41 $41 $33 $32 $3 Group Reported Earnings Before Interest & Tax $187 $176 $163 $5 $157 Gross Margin (cents per litre) EBITDA (cents per litre) To explain the SNZ financial figures for 29 (the same explanation holds for the other years): SNZ s total revenue was $2,152 million. This excludes fuel levies and GST and reflects a net contribution from shop sales at petrol stations. The Current Cost earnings (EBITDA) differ from Historic Cost earnings as a consequence of how the periods opening and closing inventory is valued. This difference is reflected in the stock value adjustment which in 29 was $38 million. SNZ had depreciation of $22 million and equity accounted income from the Refinery Company of $3 million, meaning that total reported earnings before interest and tax were $157 million. 2,58 million litres of fuel were sold that year so SNZ s gross margin (including the benefit of using the Refinery) was 14.7 cents per litre and the net margin after deducting SNZ s operating costs amounted to 5.5 cents per litre. 1

11 The valuation at which SNZ was purchased was based on projections of the future cash income the new shareholders anticipate deriving from ownership. However cash income, Historic Cost earnings (the basis of reported earnings) and Current Cost earnings can differ especially in individual reporting periods. For reasons explained below, while SNZ is projected to provide stable Current Cost earnings (ie to sell relatively stable amounts of fuel and to achieve relatively stable margins per litre sold), reported earnings and cash flows are likely to be more volatile. SNZ reported earnings (EBITDA) conform to accounting standards which require cost of sales to reflect the Historic Cost of the fuel sold. However in reality SNZ constantly sells fuel and buys product to replenish its inventory. Consequently Current Cost earnings are a more accurate measure of the company s performance. Over time, the two measurements should be approximately the same, but there will be differences in any one accounting period and generally Historic Costs earnings will be more volatile. While Current Cost earnings should be a reasonable indicator of the Company s performance, operating cash flows will reflect both the income from buying and selling fuel and changes in inventory and what is owed to suppliers or owed by customers. Comparing Earnings & Operating Cash Flow Year Ended 31 December $ millions Current Cost EBITDA $118 $111 $8 $154 $138 Reported Historic Cost EBITDA $173 $158 $15 ($6) $176 Total operating cash flows $11 $88 $215 ($147) $275 The tables at right show the reconciliation of reported Historic Cost earnings, Current Cost earnings and actual operating cash flows. The second table covers only 28 and 29 to allow a more explicit depiction of two contrasting years. These figures do not include income received on the shareholding in the Refining Company, interest, tax, divestments or new investments. Reconciling Current Cost earnings, Historic Cost earnings and Operating Cash Flows Year Ended 31 December $ millions Current Cost Earnings EBITDA $118 $111 $8 $154 $138 Stock value adjustment $55 $47 $7 ($16) $38 Reported EBITDA $173 $158 $15 ($6) $176 Change in Historic Cost inventory ($133) $4 ($13) $145 ($29) Change in receivables and payables $7 ($11) $168 ($286) $128 Total operating cash flow $11 $88 $215 ($147) $275 Inventory $388 $347 $45 $35 $334 Net receivables/ payables ($173) ($62) ($23) $56 ($72) Reconciling 28 & 29 Current Cost earnings and Operating Cash Flows Year Ended 31 December $ millions Revenue (excluding tax) $2,942 $2,152 Current Cost of goods sold ($2,543) ($1,784) Operating costs ($245) ($23) Current Cost Earnings EBITDA from buying and selling product, less all operating costs $154 $138 Net use/(purchase) of inventory at Current Cost ($15) $9 Cash flows from fuel distribution $139 $147 Net change in receivables as customers paid their bills or increased what they owed SNZ $13 ($6) Net change in payables as SNZ (reduced)/increased the amount it owed suppliers ($299) $134 Total operating cash flow ($147) $275 11

12 Despite 28 and 29 being two years when oil and fuel prices were extremely volatile, cash generated from distributing fuel was reasonably stable ($139 million in 28 and $147 million in 29). There were significant total cash flow differences from one year to the next because what SNZ owed to suppliers (payables) and was owed by customers (receivables) fluctuated, almost certainly due to factors such as when crude was loaded on a ship and other normal seasonal events. Working Capital: Inventory, Receivables & Payables SNZ s investment in working capital has fluctuated markedly over the last five years. The timing of a single cargo of fuel (which can cost over $1 million) can significantly change the figures at year end. Year Ended 31 December $ millions Inventory volume (million litres) Inventory value * $388 $347 $45 $35 $334 Receivables $129 $141 $165 $152 $158 Payables ($31) ($23) ($395) ($96) ($23) Net working capital $215 $285 $22 $361 $262 * valued at the market price of the various fuels held in inventory as at the relevant 31 December Over the last five years the quantity of SNZ s inventory has ranged between 3 million litres and 65 million litres and its value by between $2 and $65 million. Value (NZ$m) Quarterly inventory levels (volume and value) Mar 4 Sep 4 Mar 5 Sep 5 Mar 6 Sep 6 Mar 7 Sep 7 Mar 8 Sep 8 Inventory Value (LHS) Crude Volume Refined Fuels Volume Volume (m litres) Receivables (money owed to SNZ by its customers) has usually been less than payables (mainly what SNZ owed for product) because usually SNZ pays for product about a month after it was loaded on ship, while customers buying product from SNZ pay within a shorter period. The following table illustrates the payment and product cycle for one consignment of fuel. Illustrative Purchase & Sale Timetable When Transaction Cash Out Cash in Jan Oct Nov Dec Jan Feb Refining and SNZ agree a year ahead schedule of production, meaning that SNZ knows in advance its requirements for crude for Refinery processing and residual fuel needs. SNZ contracts with a producer or trader for a shipment of crude of a specified quantity and quality and sets a margin relative to an agreed benchmark. Crude placed on a ship and the US$ price fixed. Crude arrives at NZ Refinery and is refined. Refined product delivered around NZ and purchased by private and commercial users. SNZ pays the US$ cost of the shipload of crude (one month after it was placed on the ship). Cash income at service stations. Cash income from commercial customers granted terms. The table covers the progress of a single crude shipment and its associated flow of money. In reality SNZ is constantly buying and selling product. About 7% of its purchases are of crude (average cargo 11 million litres) of which there are about 15 a year. About 3% of SNZ s purchases are of refined product in average cargoes of 3-4 million litres. Individual payments for a single cargo can be up to $1 million. 12

13 SNZ Assets & Funding Shell is selling 1% of the shares in its New Zealand fuel distribution and processing business along with its 17.1% interest in New Zealand Refining Company. An approximate break down of the assets is provided in the table. Funding structure Assets being acquired NZ$million Land, buildings and plant, equipment and other fixed assets 229 retail and 95 truck stop outlets (118 freehold) Distribution, storage and processing facilities The associated land is typically leased $298.5 Working capital Inventory (crude and processed fuel) Receivables (mainly commercial customers) Payables (mainly crude suppliers) $28 Total SNZ net assets $56.5 NZ Refining stake 47.9 million shares at market value $19 Total net assets being acquired $696.5 $21M equity investment Holding Company 17.1% 1% $21M equity investment $6M debt facility for core funding and working capital SNZ Banks The values shown in the table are approximate allocations of the $696.5 million purchase value derived from the accounts of the businesses being acquired. Infratil undertook its own valuation of the 17.1% interest in Refining. The figure shown in the table is the approximate market value of those shares. There will be an inventory adjustment payment once the settlement date inventory volumes and values are identified. The $28 million working capital figure reflects estimated inventory of 4 million litres valued at $323 million which is approximately $42 million less than normalised inventory levels. Excluding the Refinery stake Infratil and NZ Super are paying approximately $548 million ($56.5 million + $42 million inventory normalisation adjustment) to acquire the SNZ fuel distribution business which last year had Current Cost earnings before interest, tax and depreciation of $138 million and reported earnings of $176 million. Infratil and NZ Super will each provide $21 million to acquire the Shell shareholdings with additional finance provided by bank loans, which are mainly to fund working capital. On settlement day, the two shareholders and the banks will provide funds to the Holding Company which will acquire the shares in the Refining Company and SNZ from Shell for $696.5 million. There will also be an up-front payment to Shell in respect of licencing royalties for use of the brand and, as noted, there may later be an inventory wash-up. The bank facilities are substantially more than was required at the time of acquisition. The additional borrowing capacity ensures headroom in future if inventory values rise. The total funding of over $1 billion (ie the total of the money actually paid to Shell and additional bank facilities to cover peak working capital demands) was an important reason Infratil and NZ Super were able to secure the SNZ businesses. Few parties in New Zealand can arrange that level of finance. In due course alternatives to conventional debt and equity may be used to fund some of SNZ s assets. In particular, service stations can be sold and leased back and inventory is amenable to supplier funding. Such arrangements free up money but increase costs (eg. rent has to be paid on leased properties) and will be judged on their merits in due course. 13

14 Forecast Over the next two years, SNZ s operations, volumes and margins are expected to be in line with 29, although reported results may fluctuate in individual accounting periods because of changes to fuel prices and refining margins. Over the medium term it is believed that SNZ will be able to increase earnings due to changes now happening in the industry and because localisation of decision making is expected to result in greater efficiency, improvements to services, and the identification of growth areas where it is productive to invest. In particular, investment is likely to yield increases in returns and value in areas such as increasing fuel storage facilities, providing a better offering at retail service stations, and developing bio-fuels. Increasing SNZ s Earnings Under Local Ownership SNZ is the market leading New Zealand fuel distribution company. Because of the fixed nature of many costs this means it is probably the lowest cost distributor. It has also been part of the global Shell network, sells technologically advanced fuels, and is a well respected brand. How will local owners do a better job and increase earnings? A number of areas are prospective. SNZ has been a division of a multinational and its various parts have reported to chief executives based outside of New Zealand. Some benefits are expected to come from greater flexibility, some from investment in better facilities. There are also areas such as bio-fuels where SNZ is likely to be more active locally than was the case when the company was part of a multinational. Increased local storage capacity is one particular field where investment may be warranted. Naturally any incremental investment will depend on the relevant economics and the availability of funds. What Infratil (And NZ Super) Are Not Buying From Shell In addition to its fuels distribution business, Shell also owns substantial oil and gas assets in New Zealand. These are all being retained by Shell. When the media covers the latest discovery of gas off Taranaki, that will have nothing to do with the SNZ businesses being acquired by Infratil and NZ Super, nor will the associated legal and environmental arguments which seem to be part and parcel of that industry. The new owners of SNZ are undertaking the investment following comprehensive due diligence of the businesses being acquired. In general the uncertainties and opportunities of SNZ are being transferred with its ownership although a small number of specific historic risks are being retained by Shell. SNZ s Transition From Multinational To Local In the short term motorists refuelling at a Shell station will be hard pressed to notice any changes. The brand will be the same. The fuel and its associated technology will be the same. The arrangements behind procurement of crude and refined product will be the same. Shell has agreed to work with the new owners to ensure their New Zealand customers experience a seamless transition. Commercial customers will notice some visible changes as the Shell brand will only be used on retail service stations. Commercial fuel deliveries will come from a tanker with a different logo. Internally SNZ will be required to make some adjustments as its financial and information systems have to be brought on-shore. Gradually SNZ s new senior management and directors will instigate changes to both improve the efficiency of the Company and to enhance its delivery to customers. 14

15 15
16 update Whilst all reasonable care has been taken to ensure the facts stated are accurate, neither Infratil Limited, Morrison & Co Infrastructure Management Limited, nor any of their directors, officers or employees guarantee the accuracy or completeness of the information stated herein.

Bondholders Report. Six months ended 30 September 2010
 Six months ended 30 September 2010 Bondholders Report We would like to thank you for your investment in our business. We d also like for you to get to know us a bit better. This short report summarises
The Cost of Electricity in Jersey
 Jersey Energy Trends 25 Headlines In 25 total final energy demand in Jersey was 187 million toe (2,17, 9 MWh) an increase of.1% on 24. Final consumption of electricity grew by 1.2% between 24 and 25. Over
Domestic Heating Oil and Fuel Poverty
 Domestic Heating Oil and Fuel Poverty 1 Introduction Northern Ireland has the largest percentage of domestic homes using heating oil in Western Europe - with 68 per cent homes (82 per cent in rural areas)
AN INVESTIGATION INTO LIQUID FUEL PRICES IN THE ISLE OF MAN A REPORT BY THE COUNCIL OF MINISTERS APRIL 2010
 GD 0015/10 AN INVESTIGATION INTO LIQUID FUEL PRICES IN THE ISLE OF MAN A REPORT BY THE COUNCIL OF MINISTERS APRIL 2010 APRIL 2010 9.20 TABLE OF CONTENTS 1. INTRODUCTION 1 1.1 Background 1 1.2 Aim of
Caltex Australia Limited (CAL)
") Australian Tax Transparency At Caltex, we exercise care in everything we do. A culture of operational excellence is formally supported through an enterprise-wide risk management framework and our management
Australian Tax Transparency At Caltex, we exercise care in everything we do. A culture of operational excellence is formally supported through an enterprise-wide risk management framework and our management
********** An short and simple explanation of how oil is converted into gasoline and then brought to you, the consumer.
 ********** An short and simple explanation of how oil is converted into gasoline and then brought to you, the consumer. CEC-180-2008-008 July 2008 CONTENTS [St e p 1 ] SOURCES [Step 2] extraction **************
SMITHS CITY GROUP LIMITED HALF YEAR REPORT
 SMITHS CITY GROUP LIMITED REPORT 31 OCTOBER 2009 TABLE OF CONTENTS Contents...1 Company Directory...2 Company Profile...3 Directors Report...4-5 Financial Information...6-8 Income Statement...6 Statement
UNDERSTANDING FUEL PRICES
 UNDERSTANDING PRICES AT THE PUMP OCTOBER 2015 UNDERSTANDING FUEL PRICES Petrol and diesel prices have an impact on family finances. Naturally, many of the UK s 38 million motorists want to know how service
Company Income Tax and Other Taxes
 Company Income Tax and Other Taxes Company Taxation Arrangements The company tax rate (also known as the corporate) is 30%. The treatment of business expenditure for the mining and petroleum industries
Fuel Prices in South Africa How is it calculated?
 Fuel Prices in South Africa How is it calculated? The petrol pump price is composed of a number of price elements and these can be divided into international elements and domestic elements. The international
BULLETIN # 128 April 23 2013. Parkland Fuel Corporation PKI-TSX; PKIUF-OTC
 BULLETIN # 128 April 23 2013 Parkland Fuel Corporation PKI-TSX; PKIUF-OTC Parkland is the largest independent marketer and distributor of refined fuels in Canada. They are simply the middle man between
<Insert Picture Here> JD Edwards EnterpriseOne Bulk Stock Industry & Overview
 JD Edwards EnterpriseOne Bulk Stock Industry & Overview 2 The following is intended to outline our general product direction. It is intended for information purposes only, and may
2011 Interim Results Presentation. Athens, 31 August 2011
 2011 Interim Results Presentation Athens, 31 August 2011 AGENDA Results Highlights Business Units Performance Financial Results Q&A 1 RESULTS HIGHLIGHTS INDUSTRY ENVIRONMENT: Conditions remain difficult
The Fuel and Vehicle Trends Report January 31, 2014
 ISSN 1948-2388 The Fuel and Vehicle Trends Report This report is a summary of the latest fuel prices and other oil industry key statistics. In addition, this report provides the latest trends in vehicle
Special Report. B&O Tax Pyramiding in. Briefly
 Since 1932 WASHINGTON RESEARCH COUNCIL Special Report January 18, 2010 B&O Tax Pyramiding in Petroleum Distribution 1. OVERVIEW Briefly For the Washington Oil Marketers Association, the Washington Research
OUR CONVERSATION TODAY
 OUR CONVERSATION TODAY Our goal is to raise the level of awareness around the oil supply chain among key stakeholders in order to facilitate positive working relationships and more informed decision making.
Sinopec Corp. Announces FY2010 Interim Results
 Sinopec Corp. Announces FY2010 Interim Results Beijing, People s Republic of China (PRC) 22 August, 2010 China Petroleum & Chemical Corporation ( Sinopec Corp. or the Company ) (CH: 600028; HKEX: 386;
Small Business Lending *
 Reserve Small Business Bank of Lending Australia Bulletin Small Business Lending * These notes were prepared in response to a request from the House of Representatives Standing Committee on Financial Institutions
3 LEGS OF THE MOTOR FUEL INDUSTRY
 3 LEGS OF THE MOTOR FUEL INDUSTRY LEG 1: PETROLEUM EXPLORATION LEG 2: OIL REFINING LEG 3: FUEL MARKETING GASOLINE MARKET SCENARIO #1 OIL COMPANY / OIL REFINER Owns or Controls Retail Property (Franchisor)
Cooper Energy and the East Coast Gas Market
 Cooper Energy and the East Coast Gas Market Cooper Energy is an ASX-listed oil and gas company that is engaged in: developing new gas supply projects; marketing gas directly to eastern Australian gas users;
Residential Heating Oil Prices: What Consumers Should know
 Residential Heating Oil Prices: What Consumers Should know Introduction Heating oil is a petroleum product used by many Americans to heat their homes. Historically, heating oil prices have fluctuated from
tutor2u Cash Management How and Why Businesses Need to Manage their Cash AS & A2 Business Studies PowerPoint Presentations 2005
 Cash Management How and Why Businesses Need to Manage their Cash AS & A2 Business Studies PowerPoint Presentations 2005 Importance of Cash (1) A business can exist for a while without making profits but
Presentation on Results for the 2nd Quarter FY 2015. Idemitsu Kosan Co.,Ltd. November 4, 2015
 Presentation on Results for the 2nd Quarter FY 2015 Idemitsu Kosan Co.,Ltd. November 4, 2015 Table of Contents 1. 2 nd Quarter FY 2015 Financials (1) Overview (2) Segment Information (3) Streamlining 2.
Support across the value chain. Expertise for Offshore Renewables Projects. rpsgroup.com/downstream
 Downstream Consultancy Support across the value chain Expertise for Offshore Renewables Projects rpsgroup.com/downstream 2 Downstream Consultancy RPS Energy a global energy consultancy n RPS Energy is
SARAS Preliminary FY 2015 and Q4 2015 results
 SARAS Preliminary FY 2015 and Q4 2015 results 29 th February 2016 29 Feb 2016 Saras SpA 1 AGENDA Highlights Segments Review Financials Outlook & Strategy Additional Information DISCLAIMER Certain statements
Oil prices and the New Zealand economy
 ARTICLES Oil prices and the economy Felix Delbruck, Economics Department This article looks at s oil consumption at a disaggregated level and discusses the consequences of movements in international oil
PETROLEUM WATCH September 16, 2011 Fossil Fuels Office Fuels and Transportation Division California Energy Commission
 PETROLEUM WATCH September 16, 2011 Fossil Fuels Office Fuels and Transportation Division California Energy Commission Summary As of September 14, retail regular-grade gasoline prices in California increased
Tipco Asphalt Public Company Limited (TASCO)
") (TASCO) Q1/2015 Opportunity Day 4 th June 2015 1 Disclaimer This presentation material has been prepared solely for informational purposes only. TASCO is furnishing it solely for use by prospective investors
(TASCO) Q1/2015 Opportunity Day 4 th June 2015 1 Disclaimer This presentation material has been prepared solely for informational purposes only. TASCO is furnishing it solely for use by prospective investors
Presentation on Results for FY 2015. Idemitsu Kosan Co.,Ltd. May 10, 2016
 Presentation on Results for FY 2015 Idemitsu Kosan Co.,Ltd. May 10, 2016 Table of Contents 1. FY 2015 Financials (1) Overview (2) Segment Information 2. Forecast for FY 2016 Performance (1) Overview (2)
Half-yearly Results. 25 July 2014
 Half-yearly Results 25 July 2014 1 1 Important notice DISCLAIMER FORWARD-LOOKING STATEMENTS This announcement may include statements that are, or may be deemed to be, "forward-looking statements". These
Example of a diesel fuel hedge using recent historical prices
 Example of a diesel fuel hedge using recent historical prices Firm A expects to consume 5,, litres of diesel fuel over the next 12 months. Fuel represents a large expense for the firm, and volatile prices
Response to the Energy White Paper Issues Paper PREPARED BY EMC ENGINEERING FOR THE AUSTRALIAN GOVERNMENT DEPARTMENT OF INDUSTRY
 Response to the Energy White Paper Issues Paper PREPARED BY EMC ENGINEERING FOR THE AUSTRALIAN GOVERNMENT DEPARTMENT OF INDUSTRY i P a g e www.energym adeclean.com CONTENTS
investing REFINING NZ ANNUAL REPORT 2012 Investing in nz s future
 07 Investing investing in nz s future Te mahi hou In 2012 the Company embarked on a $365 million project to replace an aging semi-regeneration platformer with a CCR unit. The Te Mahi Hou project will lift
Botswana Fuel Price Trends and Forecast
 Botswana Fuel Price Trends and Forecast White Paper Updated April 15 (For information purposes only) Introduction Although Botswana s energy requirements are dominated by petrol fuels, the country does
Office of the Minister of Transport. Chair Cabinet NATIONAL LAND TRANSPORT FUND: FUTURE FUNDING. Proposal
 Chair Cabinet Office of the Minister of Transport NATIONAL LAND TRANSPORT FUND: FUTURE FUNDING Proposal 1. This paper advises on future transport expenditure and revenue pressures, discusses options for
People with energy. Adding value right across the supply chain
 People with energy 140 million tonnes of fuel delivered in the last 10 years* Marine fuels is a large and complex global industry and is one of the world s foremost suppliers. Delivering on our commitment
EFFICIENT FUEL PURCHASING
 EFFICIENT FUEL PURCHASING EFFICIENT FUEL PURCHASING The unsettling news is that fuel prices continue to consume the largest portion of a motor carrier s operating expenses. Fuel is a large, necessary and
Introduction to Oil & Gas Industry, Accounting & Financial Statement Analysis. Copyright by Wall Street Prep, Inc. All rights reserved 1
 Introduction to Oil & Gas Industry, Accounting & Financial Statement Analysis Copyright by Wall Street Prep, Inc. All rights reserved 1 A number of distinct yet interconnected sectors There are a number
Q2-14 Financial Results. July 30, 2014
 Q2-14 Financial Results July 30, 2014 Forward-looking Statements & Non-GAAP Measures Information contained in these materials or presented orally on the earnings conference call, either in prepared remarks
EXPLANATORY NOTES. 1. Summary of accounting policies
 1. Summary of accounting policies Reporting Entity Taranaki Regional Council is a regional local authority governed by the Local Government Act 2002. The Taranaki Regional Council group (TRC) consists
of Fiscal 2006 (Consolidated)
") Outline of Financial Results for the 3rd Quarter of Fiscal 2006 (Consolidated) Feb.3, 2006 For Immediate Release Company Name (URL http://www.fhi.co./jp/fina/index.html ) : Fuji Heavy Industries Ltd. (Code
Outline of Financial Results for the 3rd Quarter of Fiscal 2006 (Consolidated) Feb.3, 2006 For Immediate Release Company Name (URL http://www.fhi.co./jp/fina/index.html ) : Fuji Heavy Industries Ltd. (Code
8 May 2014. New Zealand Stock Exchange Level 2, NZX Centre 11 Cable Street Wellington 6011. New Zealand. Dear Sir/Madam
 8 May 2014 New Zealand Stock Exchange Level 2, NZX Centre 11 Cable Street Wellington 6011 New Zealand Dear Sir/Madam Z Energy Limited (ZEL) Full year results announcement (for the year ended 31 March 2014)
Fair Trading (Fuel Prices) Amendment Bill 2013
 Amendment Bill 2013") 0 THE LEGISLATIVE ASSEMBLY FOR THE AUSTRALIAN CAPITAL TERRITORY (As presented) (Mr Shane Rattenbury) Fair Trading (Fuel Prices) Amendment Bill 0 Contents Page Name of Act Commencement Legislation amended
0 THE LEGISLATIVE ASSEMBLY FOR THE AUSTRALIAN CAPITAL TERRITORY (As presented) (Mr Shane Rattenbury) Fair Trading (Fuel Prices) Amendment Bill 0 Contents Page Name of Act Commencement Legislation amended
FRANKLIN ELECTRIC REPORTS RECORD SECOND QUARTER 2013 SALES AND EARNINGS
 For Immediate Release For Further Information Refer to: John J. Haines 260-824-2900 FRANKLIN ELECTRIC REPORTS RECORD SECOND QUARTER 2013 SALES AND EARNINGS Bluffton, Indiana July 30, 2013 - Franklin Electric
Analysts Briefing. 2013 Half Year Result. 23 August 2013
 Analysts Briefing 2013 Half Year Result 23 August 2013 1 Disclaimer This presentation contains forward looking statements concerning the financial condition, results and operations of The New Zealand Refining
FEDERAL RESERVE BULLETIN
 FEDERAL RESERVE BULLETIN VOLUME 38 May 1952 NUMBER 5 Business expenditures for new plant and equipment and for inventory reached a new record level in 1951 together, they exceeded the previous year's total
Consolidated Financial Results for the Six Months Ended September 30, 2013 Japanese Standards
 Consolidated Financial Results for the Six Months Ended September 30, 2013 Japanese Standards October 31, 2013 Summary of Quick Financial Announcement of Consolidated Financial Information For the Second
for Analysing Listed Private Equity Companies
 8 Steps for Analysing Listed Private Equity Companies Important Notice This document is for information only and does not constitute a recommendation or solicitation to subscribe or purchase any products.
The valuation of oil and gas reserves
 The valuation of oil and gas reserves Paper by Environmental Accounts branch, Office for National Statistics Executive summary This paper explores a number of issues involved in making a valuation of the
Planning your cash flow
 5 Planning your cash flow PROFITS ARE NOT CASH 80 OPERATING CYCLE 81 CASH FLOW BUDGETING 82 TRADE DEBTORS 87 TRADING STOCK 89 OVERCOMING CASH FLOW PROBLEMS 91 MINIMUM CASH RESERVE 92 If the cash flowing
STATE OF THE ENVIRONMENT REPORT ON NAMIBIA S INDUSTRIALISATION ENVIRONMENT Final Report: 4 August 1999 D ENERGY INDICATORS
 D ENERGY INDICATORS Energy is a broad input into human settlements and activities. It is strongly linked to a nation s GDP. Energy indicators provide a measure of efficiency and sustainability in production
NAVIGATOR A business overview and financial guide for stakeholders in the SME market
 NAVIGATOR A business overview and financial guide for stakeholders in the SME market XYZ Limited ( the Company ) Report for ABC Bank plc ( the Bank ) XX July 2012 ABC Limited ( the Company ) Report for
HIGHLIGHTS FIRST QUARTER 2016
 Q1-16 EUROPRIS ASA 2 CONTENTS / HIGHLIGHTS FIRST QUARTER 2016 HIGHLIGHTS FIRST QUARTER 2016 (Figures for the corresponding period of last year in brackets. The figures are unaudited.) Group revenues increased
Report to Minister. Fuel price differentials
 Report to Minister Fuel price differentials July 2012 Published by: NSW FAIR TRADING PO Box 972 PARRAMATTA NSW 2124 Tel. 13 32 20 NSW Fair Trading 2012 This publication is copyright. It may be reproduced
STATEMENT OF HOWARD GRUENSPECHT DEPUTY ADMINISTRATOR ENERGY INFORMATION ADMINISTRATION U.S. DEPARTMENT OF ENERGY BEFORE THE
 STATEMENT OF HOWARD GRUENSPECHT DEPUTY ADMINISTRATOR ENERGY INFORMATION ADMINISTRATION U.S. DEPARTMENT OF ENERGY BEFORE THE COMMITTEE ON ENERGY AND COMMERCE SUBCOMMITTEE ON ENERGY AND POWER UNITED STATES
Presentation on Results for the 1st Quarter FY 2014. Idemitsu Kosan Co.,Ltd. August 5, 2014
 Presentation on Results for the 1st Quarter FY 2014 Idemitsu Kosan Co.,Ltd. August 5, 2014 Table of Contents 1. FY 2014 1 st Quarter Financials (1) Overview (2) Segment Information (3) Streamlining (4)
Reduce your fleet costs in nine simple steps
 Reduce your fleet costs in nine simple steps 75% of fleets expect their costs to rise in 2010. 1 Running a cost efficient fleet is therefore more important than ever in order to keep your expenditure under
UK Energy Statistics
 PRESS NOTICE Reference: 2014/016 STATISTICAL PRESS RELEASE Date: 27 March 2014 UK Energy Statistics Energy Trends and Quarterly Energy Prices publications are published today 27 March 2014 by the Department
ROYAL MALAYSIAN CUSTOMS GOODS AND SERVICES TAX GUIDE
 ROYAL MALAYSIAN CUSTOMS GOODS AND SERVICES TAX GUIDE ON PETROLEUM DOWNSTREAM TABLE OF CONTENTS INTRODUCTION... 1 Overview of Goods and Services Tax (GST)... 1 GENERAL OPERATIONS OF PETROLEUM DOWNSTREAM...
Brookfield financial Review q2 2010
 Brookfield financial Review q2 2010 Overview Operating cash flow and gains totalled $327 million in the second quarter or $0.53 per share compared to $294 million in the prior year. This brings operating
INTERNATIONAL ACCOUNTING STANDARDS. CIE Guidance for teachers of. 7110 Principles of Accounts and. 0452 Accounting
 www.xtremepapers.com INTERNATIONAL ACCOUNTING STANDARDS CIE Guidance for teachers of 7110 Principles of Accounts and 0452 Accounting 1 CONTENTS Introduction...3 Use of this document... 3 Users of financial
Energy Value Chains. What is a Value Chain?
 Energy s Overview of Fundamentals Center for Energy Economics, UT-Austin. No reproduction, distribution or attribution without permission. 1 What is a? The process of linking specific functions from input
STRATEGIC CONSULTING AND INDUSTRY ADVISORY SERVICES Merger and Acquisition Support
 Baker & O Brien s due diligence experts often work closely with and advise financial teams on a wide range of technical and economic issues that impact the hydrocarbon processing industries. Our consultants
Retailers Discover New Ways to Drive Consistent Margins on Fuel Sales
 Retailers Discover New Ways to Drive Consistent Margins on Fuel Sales Improving gasoline margins and throughput volumes remain top-of-mind for convenience store operators, high-volume retailers and grocers
Energy White Paper at a glance
 and Science Energy White Paper at a glance WWW. i Energy White Paper at a glance The Australian Government made an election commitment to deliver an Energy White Paper to give industry and consumers certainty
Direct Line Insurance Group plc Trading Update for the first quarter of 2016
 Direct Line Insurance Group plc Trading Update for the first quarter of 4 May Direct Line Group s Trading Update relates to the first quarter ended ch, and contains information to the date of publication.
Integrated Oil Companies
 Integrated Oil Companies Loretta Bu Zhou Fang Suvayan Roy Patrick He Artur Shikhaleev Yang Zeng 1 Key Questions 2 Upstream, Midstream, Downstream, Equipment and Services Companies THE OIL SUPPLY CHAIN
Insurance Insights. When markets hit motorists. How international financial markets impact Compulsory Third Party insurance
 Insurance Insights When markets hit motorists How international financial markets impact Compulsory Third Party insurance August 2012 Chris McHugh Executive General Manager Statutory Portfolio Commercial
QUARTERLY REPORT FOR THE PERIOD ENDING 31 MARCH 2015
 QUARTERLY REPORT FOR THE PERIOD ENDING 31 MARCH 2015 HIGHLIGHTS Positive free cashflow (revenue less operating costs and CAPEX) of $191k for the month of March; a first in the history of Lynas Amended
Go Further 1Q 2015 FIXED INCOME REVIEW APRIL 28, 2015
 Go Further 1Q 2015 FIXED INCOME REVIEW APRIL 28, 2015 FORD CREDIT 1Q 2015 OPERATING HIGHLIGHTS* Another strong performance with pre-tax profit of $483 million and net income of $306 million Managed receivables
CRG CONSERVE RESOURCES GROUP ECO ENVIRONMENTAL ENGINEERING TECHNOLOGIES. NEW State of the Art. Advanced OIL REFINERY TECHNOLOGY & PROCESSES
 NEW State of the Art Advanced OIL REFINERY TECHNOLOGY & PROCESSES TABLE OF CONTENTS Introduction ( Part 1 ) Comparison Advantages Information Appendix Result of Fraction Refinery Economic indicator + Supporting
R&I Rating Methodology by Sector
 R&I Rating Methodology by Sector Logistics Companies June 9, 2014 R&I applies this rating methodology to logistics companies whose main businesses are in segments such as charter trucking operations, warehouse
Examine the multinational company BP
 Examine the multinational company BP Author: Dr. Sarah Brown British Middle-East Center for studies & Research info@bmcsr.com http:// bmcsr.com Philosophy and Economics Researcher, 1 London school of Economics
BULLETIN #113 UPDATED JULY 14, 2015 COMPANY ANALYSIS NORTHERN TIER ENERGY NTI:NYSE
 BULLETIN #113 UPDATED JULY 14, 2015 COMPANY ANALYSIS NORTHERN TIER ENERGY NTI:NYSE NTI is a pure-play, mid-continent refinery. It s a variable rate MLP (Master Limited Partnership) which pays out a big
Export Business Plan Guide
 Export Business Plan Guide Table of Contents Introduction... 4 SECTION 01: CURRENT SITUATION ANALYSIS... 5 Company Overview... 5 Availability of Resources... 6 SWOT Analysis... 9 SECTION 02: MARKET ANALYSIS...
The consolidated financial statements of
 Our 2014 financial statements The consolidated financial statements of plc and its subsidiaries (the Group) for the year ended 31 December 2014 have been prepared in accordance with International Financial
APPENDIX 4E ANNUAL REPORT THORN GROUP LIMITED ACN 072 507 147 YEAR ENDED 31 MARCH 2015. Page 1 of 7
 APPENDIX 4E ANNUAL REPORT THORN GROUP LIMITED ACN 072 507 147 YEAR ENDED 31 MARCH 2015 1 Details of the reporting period and the previous corresponding period Current period: 1 April 2014 to 31 March 2015
MMS Group FY15 Results Presentation. August 2015
 August 2015 Group Overview 2 Overview MMS generated a record financial result in FY15 o EBITDA up 20%, NPAT up 23%, EPS up 18% MMS has entered a new stage in its evolution o Step change in scale, competitiveness
OIL MARKETS AND THEIR ANALYSIS IEA ENERGY TRAINING WEEK PARIS, APRIL 2013
 OIL MARKETS AND THEIR ANALYSIS IEA ENERGY TRAINING WEEK PARIS, APRIL 2013 A (VERY) BRIEF OVERVIEW OF THE OIL INDUSTRY End consumers buy refined products (eg gasoline / diesel) Refineries buy crude oil
Accounting Practice Questions
 Accounting Practice Questions 1) The fundamental accounting equation states that: a) assets = liabilities + owner s equity b) assets = liabilities + drawings c) assets = liabilities + net income d) assets
Third Quarter 2014 Earnings Conference Call. 13 August 2014
 Third Quarter 2014 Earnings Conference Call 13 August 2014 Safe Harbor Statement & Disclosures The earnings call and accompanying material include forward-looking comments and information concerning the
Light Fleet Size Analysis
 ANNUAL FLEET STATISTICS 213 FEBRUARY 214 ISSN 2324-2116 STATISTICAL REPORT TABLE OF CONTENTS 213 FLEET REPORT HIGHLIGHTS... 2 Accessing the graphs and information in this report... 4 Describing the vehicle
 Novated lease guide Contents 1.0 Introduction 1.0 Introduction 1 1.1 What is novated leasing? 2 1.2 How does novated leasing work? 3 1.3 Benefits of a novated lease 4 1.4 Novated lease vehicle packaging
2020 vision The future of filling stations
 2020 vision The future of filling stations Fuel retailers may be fighting price wars now, but the real battle lies elsewhere. Circle s petrol retail guru Robert Onion looks forward to a return to service
Newsletter. Portuguese Economy and Energy Sector
 Newsletter Portuguese Economy and Energy Sector Q2, 2012 Economic News on Portugal The country has become a diversified and increasingly service-based economy since joining the European Community (EU).
QBE INSURANCE GROUP Annual General Meeting 2009. All amounts in Australian dollars unless otherwise stated.
 Annual General Meeting 2009 All amounts in Australian dollars unless otherwise stated. John Cloney Chairman 2 Results of proxy voting A total of 4,874 valid proxy forms were received. The respective votes
CORRAL PETROLEUM HOLDINGS AB (publ)
") CORRAL PETROLEUM HOLDINGS AB (publ) REPORT FOR THE FOURTH QUARTER AND YEAR ENDED DECEMBER 31, 2011 FOR IMMEDIATE RELEASE Date: March 30, 2012 London Nr. of pages 14 This report includes unaudited consolidated
CORRAL PETROLEUM HOLDINGS AB (publ) REPORT FOR THE FOURTH QUARTER AND YEAR ENDED DECEMBER 31, 2011 FOR IMMEDIATE RELEASE Date: March 30, 2012 London Nr. of pages 14 This report includes unaudited consolidated
Technology + Innovation = Sustainability
 Technology + Innovation = Sustainability David Woolley (CEO) & David Bessant (CFO) Q3 2012 Interim Report 1 Agenda Q3-12 Highlights DW Summary of financial results DB Economic head wind and de-stocking
Performance Food Group Company Reports First-Quarter Fiscal 2016 Earnings
 NEWS RELEASE For Immediate Release November 4, 2015 Investors: Michael D. Neese VP, Investor Relations (804) 287-8126 michael.neese@pfgc.com Media: Joe Vagi Manager, Corporate Communications (804) 484-7737
Analysis of Whether the Prices of Renewable Fuel Standard RINs Have Affected Retail Gasoline Prices
 Analysis of Whether the Prices of Renewable Fuel Standard RINs Have Affected Retail Gasoline Prices A Whitepaper Prepared for the Renewable Fuels Association Key Findings Changes in prices of renewable
Platts Oil Benchmarks & Price Assessment Methodology. October 4, 2012 - London
 Platts Oil Benchmarks & Price Assessment Methodology October 4, 2012 - London Agenda Introduction and the role of benchmarks Platts price discovery process Global commodity markets outlook Platts MOC liquidity:
Preparing a Successful Financial Plan
 Topic 9 Preparing a Successful Financial Plan LEARNING OUTCOMES By the end of this topic, you should be able to: 1. Describe the overview of accounting methods; 2. Prepare the three major financial statements
Ford Credit Earns Full-Year 2014 Pre-Tax Profit of $1.9 Billion; Net Income of $1.7 Billion*
 Ford Credit Earns Full-Year Pre-Tax Profit of $1.9 Billion; Net Income of $1.7 Billion* DEARBORN, Mich., Jan. 29, 2015 Ford Motor Credit Company reported a pre-tax profit of $1.9 billion in, its highest
In this chapter, we build on the basic knowledge of how businesses
 03-Seidman.qxd 5/15/04 11:52 AM Page 41 3 An Introduction to Business Financial Statements In this chapter, we build on the basic knowledge of how businesses are financed by looking at how firms organize
The Canadian Petroleum Products Institute Tony Macerollo, Vice President, Public and Government Affairs. June 2007
 Presentation to the Standing Committee on Industry, Science, and Technology On Gas pricing and Refining Margins By The Canadian Petroleum Products Institute Tony Macerollo, Vice President, Public and Government
JAMES A. BAKER III INSTITUTE FOR PUBLIC POLICY RICE UNIVERSITY
 JAMES A. BAKER III INSTITUTE FOR PUBLIC POLICY RICE UNIVERSITY Testimony of Kenneth B. Medlock III, PhD James A. Baker, III, and Susan G. Baker Fellow in Energy and Resource Economics, and Senior Director,
Press Conference on the Release of E.ON SE s Interim Report for the First Nine Months of 2015
 Press Conference on the Release of E.ON SE s Interim Report for the First Nine Months of 2015 Düsseldorf, November 11, 2015 Statement by: Michael Sen, CFO, E.ON SE Please check against delivery. Statement
INDIAN LUBRICANT INDUSTRY - SHRINKING MARGINS
 INDIAN LUBRICANT INDUSTRY - SHRINKING MARGINS Declining demand growth of automotive lubricants, increasing competition on account of the presence of a large number of players, and increasing raw material
Commodity Trading. NRGI Reader March 2015. Converting Natural Resources into Revenues KEY MESSAGES
 NRGI Reader March 2015 Commodity Trading Converting Natural Resources into Revenues KEY MESSAGES Commodity sales transfer natural resources physical assets into revenues. The sales can generate a large
Short-Term Energy Outlook Market Prices and Uncertainty Report
 February 2016 Short-Term Energy Outlook Market Prices and Uncertainty Report Crude Oil Prices: The North Sea Brent front month futures price settled at $34.46/b on February 4 $2.76 per barrel (b) below