Tableau Unleashed: Visualizing Library Data
|
|
|
- Andrew Henderson
- 8 years ago
- Views:
Transcription
1 Tableau Unleashed: Visualizing Library Data Jeremy Buhler, Assessment Librarian, University of British Columbia Library Rachel Lewellen, Assessment Librarian, UMass Amherst Libraries Sarah Murphy, Coordinator of Assessment, The Ohio State University Libraries Library Assessment Conference Building Effective, Sustainable, Practical Assessment August 4, 2014

2 Tableau Supports Library Assessment Integrate querying, exploring, and visualization of data into a single process; Produce flexible, in-depth, multi-dimensional, and interactive displays; Access and drill-down into data directly, minimizing data silos while saving employee time; and Transition from static to dynamic reporting

3 Questions Guiding Our Discussion Discuss how your library has incorporated Tableau into its assessment program. What impact has Tableau had on your ability to make sense of large data sets, make data accessible, and improve stakeholder communications? Where does Tableau fit in your library s data strategy?

4 UNIVERSITY LIBRARIES 7


5 UNIVERSITY LIBRARIES 8

6 UNIVERSITY LIBRARIES 9

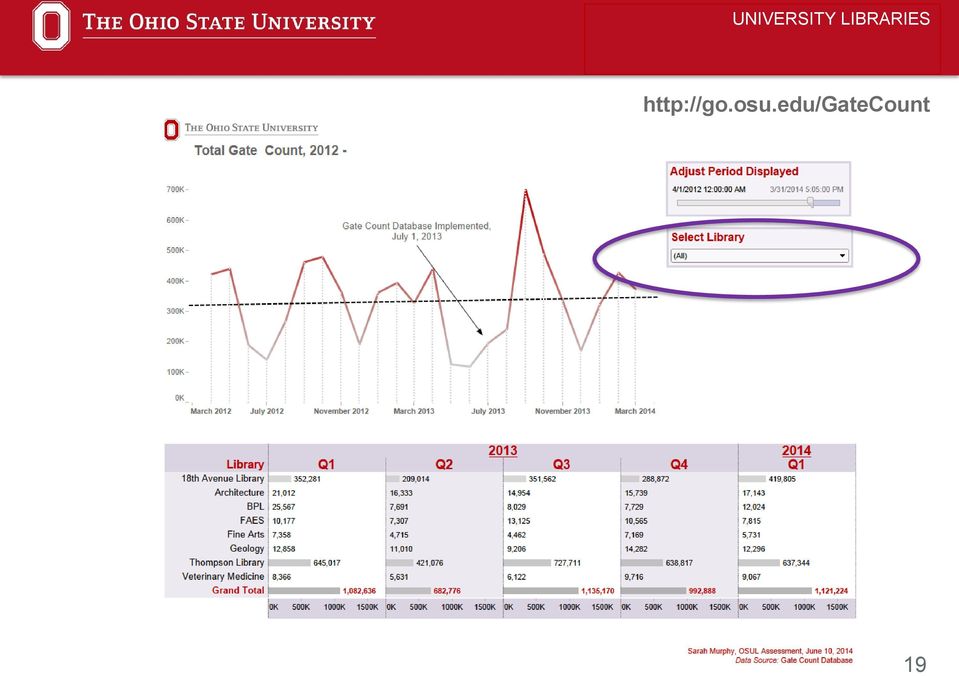
7 UNIVERSITY LIBRARIES Blends data from LibAnswers and previous incarnations of the OSU Libraries Ask Database Over 200,000 rows May post a data set with up to 1 million rows on Tableau Public 10

8 UNIVERSITY LIBRARIES 18


9 UNIVERSITY LIBRARIES 19
10 UNIVERSITY LIBRARIES 20


11 UNIVERSITY LIBRARIES ILLIAD(AllBorrowing)

12 UNIVERSITY LIBRARIES ILLIAD(AllBorrowing)


13 UNIVERSITY LIBRARIES ILLIAD(AllBorrowing)


14 UNIVERSITY LIBRARIES ILLIAD(AllBorrowing)

15 UNIVERSITY LIBRARIES ILLIAD(AllBorrowing)

16 UNIVERSITY LIBRARIES ILLIAD(AllBorrowing)2010- Data blended from ILLIAD, Sierra, and other sources Librarians assigned to user department User department not a good surrogate for interdisciplinary research areas 26


17 UNIVERSITY LIBRARIES ILLIAD(AllBorrowingLanguages)


18 UNIVERSITY LIBRARIES ILLIAD(AllBorrowingLanguages)


19 Tableau at UMass Amherst Rachel Lewellen Assessment Librarian August 4, 2014 UMass Amherst Libraries

20 Guiding Questions Tableau is a major component of our assessment program Increase our capacity to use library data Analyze and communicate data Support decision making Practical department level decisions Broad collection, service, and facilities implications Demonstrate fiscal accountability and budgetary needs 35


21 Selector Dashboard 36

22 Non Circulating Items with Duplication Status 37
23 LC Class, FY
24 School and College Total - FY
25 School and College Total with Circ FY

26 Order Group Total FY
27 EBL Dashboard by Library 42
28 EBL Use Summary Dashboard 43

29 EBL Trigger Purchase Scenarios 44

30 Spreadsheet Compared to Visual Display 45
31 Tableau at UBC Library Drilling into the data Jeremy Buhler Assessment Librarian August 4, 2014
32 An effective dashboard answers a specific question. An effective dashboard leads to more and better informed questions. Tableau makes it easier to respond.
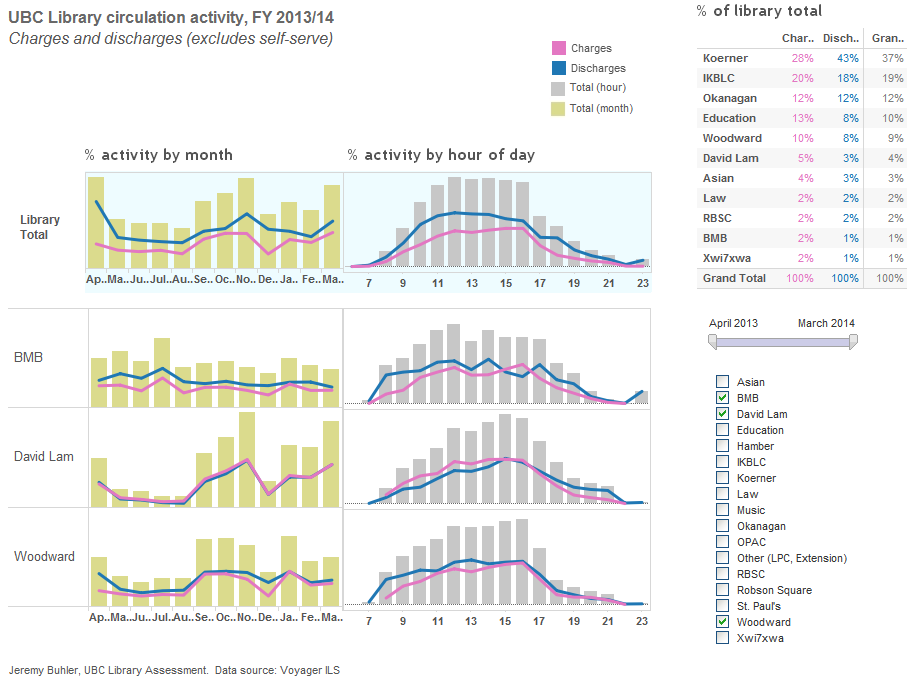
33 Example #1 How is the circulation workload distributed across UBC Library branches?
34

35 2013/14 circulation: % activity by month 24% of annual total 38% 10% Summer

36 2013/14 circulation: % activity by hour 16% of daily total 10% 6-10pm

37 2013/14 circulation: % activity by hour Discharging items later in the day to improve workload balance
38 Example #2 What do LibQUAL results tell us about respondents priorities?
39 LibQUAL: visualizing results LibQUAL service levels desired perceived minimum orange band is the range between minimum (6.8) and desired (8.2) service levels blue dot shows perception of the service UBC Library provides

40 LibQUAL: performance by service area

41 LibQUAL: change across user groups Collections and access priorities The printed library materials I need for my work

42 LibQUAL: change over time The printed library materials I need for my work Health Sciences Humanities Science/Math Social Sciences
43 Recommended reading Few, Stephen. Information dashboard design: The effective visual communication of data. O Reilly, 2006.
Using Tableau for Visual Analytics in Libraries Nicole Sibley Simmons College
 Using Tableau for Visual Analytics in Libraries Nicole Sibley Simmons College Using Tableau for Visual Analytics in Libraries 2 With the rise of big data, information visualization is emerging as an area
Visualizing Multidimensional Data Through Time Stephen Few July 2005
 Visualizing Multidimensional Data Through Time Stephen Few July 2005 This is the first of three columns that will feature the winners of DM Review's 2005 data visualization competition. I want to extend
Quantitative Displays for Combining Time-Series and Part-to-Whole Relationships
 Quantitative Displays for Combining Time-Series and Part-to-Whole Relationships Stephen Few, Perceptual Edge Visual Business Intelligence Newsletter January, February, and March 211 Graphical displays
Online Search Engine Advertising Data Visualization Tool
 Online Search Engine Advertising Data Visualization Tool Project Proposal Yingsai Dong dysalbert@gmail.com Department of Computer Science University of British Columbia CPSC 547 Information Visualization
Best Practices for Deploying Managed Self-Service Analytics and Why Tableau and QlikView Fall Short
 Best Practices for Deploying Managed Self-Service Analytics and Why Tableau and QlikView Fall Short Vijay Anand, Director, Product Marketing Agenda 1. Managed self-service» The need of managed self-service»
University of Gaziantep, Department of Business Administration
 University of Gaziantep, Department of Business Administration The extensive use of information technology enables organizations to collect huge amounts of data about almost every aspect of their businesses.
ProClarity Analyst Training
 ProClarity Analyst Training 50001: ProClarity Analyst Training (5 Days) About this Course This five-day instructor-led course provides students with the knowledge and skills to expand the capabilities
Tableau 6, Business Intelligence made personal
 Tableau 6, Business Intelligence made personal Is traditional Business Intelligence obsolete? Stephen McDaniel Principal Analyst and Co-founder Freakalytics, LLC www.freakalytics.com Tableau 6 is a major
Finance Reporting. Edition (OBIEE) Training
 Training") Finance Reporting Oracle Business Intelligence Enterprise Edition (OBIEE) Training Corazon Wong July 2009 Topics to be Covered Data Warehouse Overview OBIEE Answers and Dashboards Business Intelligence
Finance Reporting Oracle Business Intelligence Enterprise Edition (OBIEE) Training Corazon Wong July 2009 Topics to be Covered Data Warehouse Overview OBIEE Answers and Dashboards Business Intelligence
Integrated Reporting Governance Committee. February 14 th, 2014
 Integrated Reporting Governance Committee February 14 th, 2014 Agenda Confirm Terms of Reference (20 mins) Program Updates (40 min) Financial Analytics Reports Tuition Allocation Model IR Roadmap (30 mins)
Delivering business intelligence to your managers:
 Delivering business intelligence to your managers: HR Dashboards Can they help organisations plan, monitor and improve? By Simon Lind Simon Lind leads the HRIS practice at Montage Business Intelligence
Enhancements to State Reports
 click the icon to go to the contents The Challenge of Data How and Why of Data Visualization Interactive Dashboards Electronic Data Walls Enhancements to State Reports Next Steps THE CHALLENGE OF DATA
WELCOME AND GOOD MORNING! DATA BUSINESS PARTNER WORKING WITH DATA GRAPHICALLY THE REAL FACE OF BIG DATA ANALYTICS
 WELCOME AND GOOD MORNING! DATA BUSINESS PARTNER WORKING WITH DATA GRAPHICALLY THE REAL FACE OF BIG DATA ANALYTICS Steve Frederick Business Intelligence Evangelist Information Builders 1 What is Big Data
Today. Oh, The Things You Can Think! 12/8/2013. After our session, you should be able to... How to Really See Your Assessment Data
 Oh, The Things You Can Think! How to Really See Your Assessment Data CS-150 (Strand 5) Monday, December 9, 2013 3:00 4:00 p.m. Robin Logan & Dr. Glenn James University of the Incarnate Word, San Antonio
MicroStrategy Desktop
 MicroStrategy Desktop Quick Start Guide MicroStrategy Desktop is designed to enable business professionals like you to explore data, simply and without needing direct support from IT. 1 Import data from
San Francisco Public Library. Preliminary Security Resources Analysis
 San Francisco Public Library Preliminary Security Resources Analysis Project Team Randle McClure, Celeste Berg & Sarah Swanbeck City Performance Unit, February 6, 014 Project Overview Security Resources
How To Run A Run Dashboard On An Aca.Edu
 Chairs and Deans Argos Dashboards Guide The following guide is provided to assist you in running and understanding the information that the dashboard in Argos returns. The dashboard located through the
ReceivablesVision SM Getting Started Guide
 ReceivablesVision SM Getting Started Guide March 2013 Transaction Services ReceivablesVision Quick Start Guide Table of Contents Table of Contents Accessing ReceivablesVision SM...2 The Login Screen...
Empower Individuals and Teams with Agile Data Visualizations in the Cloud
 SAP Brief SAP BusinessObjects Business Intelligence s SAP Lumira Cloud Objectives Empower Individuals and Teams with Agile Data Visualizations in the Cloud Empower everyone to make data-driven decisions
Building Capacity to Use Infographic Tools
 Building Capacity to Use Infographic Tools free options for creating charts, graphs, and pictorial infographics Arielle Winchester and Amanda Makulec John Snow Inc. Objectives Describe two reasons for
Deploying Governed Data Discovery to Centralized and Decentralized Teams. Why Tableau and QlikView fall short
 Deploying Governed Data Discovery to Centralized and Decentralized Teams Why Tableau and QlikView fall short Agenda 1. Managed self-service» The need of managed self-service» Issues with real-world BI
Sterling Business Intelligence
 Sterling Business Intelligence Concepts Guide Release 9.0 March 2010 Copyright 2009 Sterling Commerce, Inc. All rights reserved. Additional copyright information is located on the documentation library:
Public Health Activities and Services Tracking (PHAST) Interactive Data Visualization Tool User Manual
 Interactive Data Visualization Tool User Manual") Public Health Activities and Services Tracking (PHAST) Interactive Data Visualization Tool User Manual Funded by a grant from the Robert Wood Johnson Foundation. http://phastdata.org PHAST Interactive
Public Health Activities and Services Tracking (PHAST) Interactive Data Visualization Tool User Manual Funded by a grant from the Robert Wood Johnson Foundation. http://phastdata.org PHAST Interactive
A Strategy for Managing Freight Forecasting Data Resources
 A Strategy for Managing Freight Forecasting Data Resources Florida State University Rebecca Augustyniak, MS, Principal Investigator Amy Finley, MS, Project Director, Co Principal Investigator Brian Arsenault,
This file contains 2 years of our interlibrary loan transactions downloaded from ILLiad. 70,000+ rows, multiple fields = an ideal file for pivot
 Presented at the Southeastern Library Assessment Conference, October 22, 2013 1 2 3 This file contains 2 years of our interlibrary loan transactions downloaded from ILLiad. 70,000+ rows, multiple fields
Data Analytics Leveraging Data Visualization and Automation in Audit Real World Examples
 Data Analytics Leveraging Data Visualization and Automation in Audit Real World Examples June 3, 2015 Cliff Stephens, CISA Agenda Introductions Technological Advances in Analytics Capitalizing on Analytics
FastTrack User Guide - Microsoft & Partners
 FastTrack User Guide - Microsoft & Partners This guide contains step by step instructions to help Microsoft and Microsoft partner users understand the new FastTrack site. This guide covers site registration,
Project Management System Services
 Project Management System Services Today's projects need to deal with increasing amounts of information that require better tools to help navigate through all the data produced by projects. Our services
Library Resources for RN to BSN Nursing Students. Module 3.1 Introduction to E-Books
 Library Resources for RN to BSN Nursing Students Module 3.1 Introduction to E-Books Research Questions? Contact a Librarian at Moye Library Regular Library Hours:* Monday-Thursday 8:00 a.m.-11:00 p.m.
EFFICIENTLY RUN YOUR OPERATIONS. Accounts Receivable Track individual clients, organizations, and funding sources separately.
 At a Glance years serving the nonprofit and education sectors MANAGE ACCOUNTING FOR NONPROFITS REPORT AND BUDGET WITH CONFIDENCE EFFICIENTLY RUN YOUR OPERATIONS MAINTAIN DATA INTEGRITY UNDERSTAND AND MANAGE
Canadian Association for Research Libraries Toronto, Ontario 14 October 2015
 Canadian Association for Research Libraries Toronto, Ontario 14 October 2015 Introductions Help & Learning Standard Reports Audience Traffic Sources Content Behaviour Measuring Value Basic Filtering &
Creating a Successful Single Service Point for Circulation and Reference in an Academic Library
 Creating a Successful Single Service Point for Circulation and Reference in an Academic Library Mary Ann Venner, Head of Access Services University of North Texas Libraries Bethany Hardikar, Library Services
DALHOUSIE NOTES ON PAYROLL EXPENSE DETAIL IN FINANCE SELF SERVICE. QUICK REFERENCE As of September 1, 2015
 DALHOUSIE NOTES ON PAYROLL EXPENSE DETAIL IN FINANCE SELF SERVICE QUICK REFERENCE As of September 1, 2015 Quick reference document outlining the basic steps to access the payroll expense detail results
Big Data at Cloud Scale
 Big Data at Cloud Scale Pushing the limits of flexible & powerful analytics Copyright 2015 Pentaho Corporation. Redistribution permitted. All trademarks are the property of their respective owners. For
MiPCT Dashboard Report Writer User Guide
 MiPCT Dashboard Report Writer User Guide Report_Writer_User_Guide.docx Page 2 of 5 About the Report Writer The report writer enables you to select individual components from each Dashboard page to view
In-Memory or Live Data: Which Is Better?
 In-Memory or Live Data: Which Is Better? Author: Ellie Fields, Director Product Marketing, Tableau Software July 2011 p2 The short answer is: both. Companies today are using both to deal with ever-larger
Using Tableau Software with Hortonworks Data Platform
 Using Tableau Software with Hortonworks Data Platform September 2013 2013 Hortonworks Inc. http:// Modern businesses need to manage vast amounts of data, and in many cases they have accumulated this data
Cal Answers Dashboard Reports Student All Access - Degrees
 Cal Answers Dashboard Reports Student All Access - Degrees Office of Planning & Analysis Associate Vice Chancellor for Budget & Resource Planning University of California, Berkeley May 2011 Table of Contents
IBM Cognos Analysis for Microsoft Excel
 IBM Cognos Analysis for Microsoft Excel Explore and analyze data in a familiar spreadsheet format Highlights Explore and analyze data drawn from IBM Cognos TM1 models and IBM Cognos Business Intelligence
2 WKS 2 YRS 100S. Vertex Services Improves Global Understanding with Tableau
 CUSTOMER SUCCESS STORY Vertex Services Improves Global Understanding with Tableau THE WORLD LEADER IN PRIVATE BRAND FLOORING HEADQUARTERS: NORWALK, CT KEY REGIONAL OFFICES: HONG KONG SHANGHAI KUALA LUMPUR
CRM Analytics. SAP enhancement package 1 for SAP CRM 7.0. Gert Tackaert
 CRM Analytics SAP enhancement package 1 for SAP CRM 7.0 Gert Tackaert Agenda 1. CRM Analytics the right tool for the right user experience SAP BusinessObjects integration in CRM 2. SAP CRM Interactive
Performance Dashboards in Local Government: What, Why, and How?
 Performance Dashboards in Local Government: What, Why, and How? City of Portland TriMet TSCC Quarterly Meeting August 18, 2015 Dashboards: An Overview What s Driving the Interest in Performance Dashboards?
SBI2013: Building BI Solutions using Excel and SharePoint 2013
 UNDERSTANDING MICROSOFT'S BI TOOLSET 3 DAYS SBI2013: Building BI Solutions using Excel and AUDIENCE FORMAT COURSE DESCRIPTION Business Analysts and Excel Power Users Instructor-led training with hands-on
Data tells stories, and business analytics depends on data. Hearing the stories in the data, however, only happens when you have people with the
 Data tells stories, and business analytics depends on data. Hearing the stories in the data, however, only happens when you have people with the right listening skills. Skilled people are the heart of
Create Mobile, Compelling Dashboards with Trusted Business Warehouse Data
 SAP Brief SAP BusinessObjects Business Intelligence s SAP BusinessObjects Design Studio Objectives Create Mobile, Compelling Dashboards with Trusted Business Warehouse Data Increase the value of data with
In-Memory or Live Data: Which is Better?
 In-Memory or Live Data: Which is Better? AUTHOR: Ellie Fields, Director Product Marketing, Tableau Software DATE: July 2011 The short answer is: both. Companies today are using both to deal with ever-larger
Business Intelligence Tools Information Session and Survey. December, 2012
 Business Intelligence Tools Information Session and Survey December, 2012 Agenda Introduction to Business Intelligence (BI) Common Business Intelligence Uses in Higher Education UMass: Mobile President
BEx Analyzer (Business Explorer Analyzer)
") BEx Analyzer (Business Explorer Analyzer) Purpose These instructions describe how to use the BEx Analyzer, which is utilized during budget development by account managers, deans, directors, vice presidents,
BEx Analyzer (Business Explorer Analyzer) Purpose These instructions describe how to use the BEx Analyzer, which is utilized during budget development by account managers, deans, directors, vice presidents,
Tableau Tutorial. User Documentation. Archit Sood, Neha Sinha, Shashank Dewjee, and Wei Zhao
 Tableau Tutorial User Documentation Archit Sood, Neha Sinha, Shashank Dewjee, and Wei Zhao Table of Contents Introduction... 2 Tableau desktop (Business analytics anyone can use)... 2 Tableau server...
Business Intelligence at the University of Minnesota
 Business Intelligence at the University of Minnesota Defining the need and the solution for a comprehensive decision support system for the University of Minnesota Internal Communications Network December
Development of an Integrated Data Management System (Web based) City of Chattanooga
 City of Chattanooga") Development of an Integrated Data Management System (Web based) for NDPES Compliance and BMP Tracking (MS4 Activities) City of Chattanooga SESWA 2011 Annual Conference October 3-5, 2011 Asheville Renaissance
Development of an Integrated Data Management System (Web based) for NDPES Compliance and BMP Tracking (MS4 Activities) City of Chattanooga SESWA 2011 Annual Conference October 3-5, 2011 Asheville Renaissance
Cal Answers Dashboard Reports Student All Access - Degrees
 Cal Answers Dashboard Reports Student All Access - Degrees Office of Planning & Analysis Associate Vice Chancellor Chief Financial Officer University of California, Berkeley April 2012 Table of Contents
Qualification of Staff
 Mayor s Blue Ribbon Taskforce for the Miami-Dade Public Library System Qualification of Staff This section presents staffing levels, minimum qualification of levels, nature of work, salary range, table
Τhe SAS BI delivers business-critical answers ahead of the competition Yannis Salamaras Senior Business Intelligence Consultant SAS Greece & Cyprus
 Τhe SAS BI delivers business-critical answers ahead of the competition Yannis Salamaras Senior Business Intelligence Consultant SAS Greece & Cyprus The Value of the Information What s wrong with this picture?
Dashboard Design for Rich and Rapid Monitoring
 Dashboard Design for Rich and Rapid Monitoring Stephen Few Visual Business Intelligence Newsletter November 2006 This article is the fourth in a five-part series that features the winning solutions to
Unlock Business Agility with Oracle Business Intelligence Cloud Service (BICS)
") Unlock Business Agility with Oracle Business Intelligence Cloud Service (BICS) Presented by: Stephen Goldsmith (BizTech) Brian Shreeves (Oracle) Date: June 19, 2015 Agenda About BizTech Introducing the
Unlock Business Agility with Oracle Business Intelligence Cloud Service (BICS) Presented by: Stephen Goldsmith (BizTech) Brian Shreeves (Oracle) Date: June 19, 2015 Agenda About BizTech Introducing the
General Ledger and Fixed Assets January 12, 2011
 General Ledger and Fixed Assets January 12, 2011 2 General Ledger New and Changed Features Terminology Changes Journal Copy Account Replacement Account Inquiry Web ADI Journal Upload Web ADI Asset Upload
Building Bridges: The Link Between Strategic Planning and Budgeting
 Building Bridges: The Link Between Strategic Planning and Budgeting Dr. Sona K. Andrews Vice Chancellor for Academic Strategies Oregon University System Stacy Pearson Vice President for Finance and Administration
Online Channel Office Project Alliance Management Office Report August 2011
 Online Channel Office Project Alliance Management Office Report August 2011 1. Overview Service BC was formed in 2004, centralizing service delivery for government to citizens and businesses. The channels
Duplication Problem. Duplicating Columns
 The amount of data required to perform our work today can be staggering. A fundamental question is, How should data be stored? Many people will use spreadsheets for data storage. Creating a spreadsheet
541-974-5683 (cell) 8462 Eastchase Parkway, #11308 ~ Montgomery, AL 36117 clark_ksa@yahoo.com
 8462 Eastchase Parkway, #11308 ~ Montgomery, AL 36117 clark_ksa@yahoo.com") 541-974-5683 (cell) 8462 Eastchase Parkway, #11308 ~ Montgomery, AL 36117 clark_ksa@yahoo.com PROFESSIONAL PROFILE Seasoned institutional research (IR) professional with strong history of applying engineering,
541-974-5683 (cell) 8462 Eastchase Parkway, #11308 ~ Montgomery, AL 36117 clark_ksa@yahoo.com PROFESSIONAL PROFILE Seasoned institutional research (IR) professional with strong history of applying engineering,
PBI365: Data Analytics and Reporting with Power BI
 POWER BI FOR BUSINESS ANALYSTS AND POWER USERS 3 DAYS PBI365: Data Analytics and Reporting with Power BI AUDIENCE FORMAT COURSE DESCRIPTION Business Analysts, Statisticians and Data Scientists Instructor-led
Beyond the Basics: Making the Most of Oracle Enterprise Manager 12c Monitoring
 Beyond the Basics: Making the Most of Oracle Enterprise Manager 12c Monitoring Ana McCollum Director of Product Management Oracle Enterprise Manager September 29, 2014 Safe Harbor Statement The following
SAP Crystal Solutions. What s New in SAP Crystal Dashboard Design Create Superior Data Visualizations Faster with New Features
 SAP Crystal Solutions What s New in SAP Crystal Dashboard Design Create Superior Data Visualizations Faster with New Features CONTENT 4 Key Features of SAP Crystal Dashboard Design 4 New in SAP Crystal
MedIT Strategic Plan. Mission: To support excellence in health education, research, and service with innovative and sustainable technology solutions.
 MedIT Strategic Plan 2010 2013 Mission: To support excellence in health education, research, and service with innovative and sustainable technology solutions. The UBC Faculty of Medicine and MedIT work
Ten Mistakes to Avoid When Creating Performance Dashboards
 Ten Mistakes to Avoid When Creating Performance Dashboards Wayne W. Eckerson Wayne W. Eckerson is the director of research and services for TDWI, a worldwide association of business intelligence and data
Designing Information Displays. Overview
 Designing Information Displays Claremont Graduate University Professional Development Workshop August 23, 2015 Tarek Azzam Ph.D. 8 6 4 2 0-2 -4-6 Site 5 Site 7 Site 1 Site 4 Site 2 Site 3 Site 6 Overview
MOC 20467B: Designing Business Intelligence Solutions with Microsoft SQL Server 2012
 MOC 20467B: Designing Business Intelligence Solutions with Microsoft SQL Server 2012 Course Overview This course provides students with the knowledge and skills to design business intelligence solutions
Informatica for Tableau Best Practices to Derive Maximum Value
 for Best Practices Guide Informatica for Tableau Best Practices to Derive Maximum Value What is Informatica for Tableau Are you struggling to get the most out of Tableau because you need to pull, combine,
How to Use EBooks in the Library Catalog
 How to Use EBooks in the Library Catalog DiMenna-Nyselius Library Fairfield University EBooks are books that have been published in a digital format. o At Fairfield University, EBooks can be accessed through
IBM Cognos Analysis for Microsoft Excel
 IBM Software Group Data Sheet IBM Cognos Analysis for Microsoft Excel Highlights Explore and analyze trusted and secure BI data in a familiar spreadsheet format Develop high frequency and high priority
Accelerating Understanding Through Data Visualization. The power of storytelling
 Accelerating Understanding Through Data Visualization The power of storytelling Accenture Technology Lab s Data Insights R&D Group focuses on accelerating the ways in which companies extract meaning from
In-Memory or Live Reporting: Which Is Better For SQL Server?
 In-Memory or Live Reporting: Which Is Better For SQL Server? DATE: July 2011 Is in-memory or live data better when running reports from a SQL Server database? The short answer is both. Companies today
Selection Requirements for Business Activity Monitoring Tools
 Research Publication Date: 13 May 2005 ID Number: G00126563 Selection Requirements for Business Activity Monitoring Tools Bill Gassman When evaluating business activity monitoring product alternatives,
Taking the pain out of Risk and Compliance Management Systems. Presented by Andrew Batten 23 April 2015
 Taking the pain out of Risk and Compliance Management Systems Presented by Andrew Batten 23 April 2015 Operational Improvement Technology Solutions Providing consultancy services Gap assessments Food standard
Vendor briefing Business Intelligence and Analytics Platforms Gartner 15 capabilities
 Vendor briefing Business Intelligence and Analytics Platforms Gartner 15 capabilities April, 2013 gaddsoftware.com Table of content 1. Introduction... 3 2. Vendor briefings questions and answers... 3 2.1.
JOB ANNOUNCEMENT. 40 hours per week. $80,100 - $90,000 per year DOQ (1 FTE) Grade 14 Exempt status
 Grade 14 Exempt status") JOB ANNOUNCEMENT POSITION TITLE: POSITION NUMBER: 80-001 HOURS: Time limited Full-Time 40 hours per week Position is funded for two years, with possible extension. This position requires some flexibility
JOB ANNOUNCEMENT POSITION TITLE: POSITION NUMBER: 80-001 HOURS: Time limited Full-Time 40 hours per week Position is funded for two years, with possible extension. This position requires some flexibility
Launch into the Oracle Business Intelligence Cloud Service (BICS) Presented by: Stephen Goldsmith Date: May 15, 2015
 Presented by: Stephen Goldsmith Date: May 15, 2015") Launch into the Oracle Business Intelligence Cloud Service (BICS) Presented by: Stephen Goldsmith Date: May 15, 2015 Agenda About Me About BizTech Introducing the Oracle Business Intelligence Cloud Service
Launch into the Oracle Business Intelligence Cloud Service (BICS) Presented by: Stephen Goldsmith Date: May 15, 2015 Agenda About Me About BizTech Introducing the Oracle Business Intelligence Cloud Service
A sample article workflow using Direct Request & the OCLC Knowledge Base
 A sample article workflow using Direct Request & the OCLC Knowledge Base Brian Miller Head, Interlibrary Services We ll look at both: Borrowing Lending Institution Name The Ohio State University OCLC
Tips and Tricks. Table of Contents. Run Control ID
 Tips and Tricks Table of Contents Contents Table of Contents... 1 Run Control ID... 1 Running Reports in Core-CT... 2 Downloading Reports to Excel... 3 Journal Source Types... 4 Entering Parameters...
BANA6037 Data Visualization Fall Semester 2014 (14FS) / First Half Session Section 001 S 9:00a- 12:50p Lindner 107
 / First Half Session Section 001 S 9:00a- 12:50p Lindner 107") BANA6037 Data Visualization Fall Semester 2014 (14FS) / First Half Session Section 001 S 9:00a- 12:50p Lindner 107 Instructors: Jeffrey A. Shaffer Vice President, IT and Analytics, Unifund JeffreyShaffer@gmail.com
BANA6037 Data Visualization Fall Semester 2014 (14FS) / First Half Session Section 001 S 9:00a- 12:50p Lindner 107 Instructors: Jeffrey A. Shaffer Vice President, IT and Analytics, Unifund JeffreyShaffer@gmail.com
Sales Management in Microsoft Dynamics CRM 2015 DYNA02; 1 Day; Instructor-led
 Sales Management in Microsoft Dynamics CRM 2015 DYNA02; 1 Day; Instructor-led Course Description This course introduces the capabilities of Sales Management in Microsoft Dynamics CRM 2013 that allow you
SalesLogix Advanced Analytics
 SalesLogix Advanced Analytics SalesLogix Advanced Analytics Benefits Snapshot Increase organizational and customer intelligence by analyzing data from across your business. Make informed business decisions
Learning from our Users: Using Assessment to Drive Change. LibQUAL+ Share Fair ALA Annual Conference New Orleans, Louisiana June 27, 2011
 Learning from our Users: Using Assessment to Drive Change LibQUAL+ Share Fair ALA Annual Conference New Orleans, Louisiana June 27, 2011 Objectives Overview LibQUAL+ Focus Groups Ethnographic study Comparison
Education Data Management. Turning Data into Actionable Information that Impacts Student Achievement
 Education Data Management Turning Data into Actionable Information that Impacts Student Achievement The Big Picture: High quality data is essential for high quality education Three Take-Aways : 1. What
Business intelligence requirements for IT: What every IT manager should know about business users real needs for BI
 Business intelligence requirements for IT: What every IT manager should know about business users real needs for BI January 2011 p2 Business users and organizations need the ability to quickly analyze
Today s Presenter. Linda Hofschire Research Analyst, Library Research Service, Colorado State Library
 Today s Presenter Linda Hofschire Research Analyst, Library Research Service, Colorado State Library Data Visualization for the Rest of Us: A Beginner s Guide Linda Hofschire Library Research Service,
OPEN.MICHIGAN Database Project
 OPEN.MICHIGAN Database Project Alexis Antracoli Gin Corden Andrew Gordon Sarah Mackintosh Dave Malicke Christine Murray Table of Contents Client Information and Needs... 2 Users... 2 Contents... 3 E-R
NAI Global s Technology Solutions
 NAI Global s Technology Solutions One of the key aspects of any successful technology implementation is the ability to quickly bring to the user desktop, that critical information that is integrated across
5 tips for deploying insightful reports in the federal government
 5 tips for deploying insightful reports in the federal government Author: Malia Hardin Senior Product Marketing Manager, Tableau Software June 2011 p2 Your budget is shrinking. Your spending is scrutinized.
Integrated Enterprise Reporting
 Integrated Enterprise Reporting July 2013 Don McNatty Abstract Integrated Reporting can be accomplished by using reporting and dashboard tools that support accessing multiple data sources directly or through
PATSEER PROJECTS. Patent Project Management, Analytics and Collaboration Made Easy
 PATSEER PROJECTS Patent Project Management, Analytics and Collaboration Made Easy About Us 10 years of experience in Intellectual Property Solutions Launched Patent insight Pro in Jan 2006 and gained quick
2016 Catalog. Location: TBD (scheduled throughout the year as necessary) Audience: All employees
 Audience: All employees") 2016 Catalog Learn how to initiate an Electronic Personal Action Form (EPAF): (1.5 hours) Participants will gain an understanding on how to initiate EPAFs and how they are applied into the Banner system.
2016 Catalog Learn how to initiate an Electronic Personal Action Form (EPAF): (1.5 hours) Participants will gain an understanding on how to initiate EPAFs and how they are applied into the Banner system.
Oracle BI Suite Enterprise Edition For Discoverer Users. Mark Rittman, Rittman Mead Consulting http://www.rittmanmead.com
 Oracle BI Suite Enterprise Edition For Discoverer Users Mark Rittman, Rittman Mead Consulting http://www.rittmanmead.com Who Am I? Oracle BI&W Architecture & Development Specialist The Rittman of Rittman
Analysis for everyone
 Analysis for everyone Highlights Satisfying the spectrum of user needs with simple to advanced analysis Getting the right people engaged in the decision-making process Delivering analysis where and when
10 Hard Questions to Make Your Choice of Cloud Analytics Easier
 10 Hard Questions to Make Your Choice of Cloud Analytics Easier Introduction Key stakeholders and executive sponsors of business intelligence solutions need an easy-to-digest view into industry terms and
PROVIDING INSIGHT FOR OPERATIONAL SUCCESS
 idashboards for Operations Management PROVIDING INSIGHT FOR OPERATIONAL SUCCESS idashboards helped Precoat move from manual data mining and paper reports to a system that allows us to identify best practices
www.tekclasses.com +91-8970005497/+91-7411642061 info@tekclasses.com / contact@tekclasses.com TABLEAU TRAINING DURATION 30hrs
 TABLEAU TRAINING DURATION 30hrs AVAILABLE BATCHES WEEKDAYS (6.30AM TO 7.30AM) & WEEKENDS (10AM TO 1PM) MODE OF TRAINING AVAILABLE ONLINE INSTRUCTOR LED CLASSROOM TRAINING (MARATHAHALLI, BANGALORE) SELF
PNEC 2015: White Paper The Well Hierarchy as a Foundation for MDM: A Case Study Author
 PNEC 2015: White Paper The Well Hierarchy as a Foundation for MDM: A Case Study Author Steve Cooper, President, EnergyIQ E: steve.cooper@energyiq.info Contents Work Ownership and Copyright... 2 1. Introduction...