Climate Observation Data and Tools. Kelly T. Redmond. Western Regional Climate Center Desert Research Institute Reno Nevada
|
|
|
- Merryl Cummings
- 8 years ago
- Views:
Transcription
1 Climate Observation Data and Tools Kelly T. Redmond Western Regional Climate Center Desert Research Institute Reno Nevada Western Watersheds and Climate Change Water and Aquatic System Tools Workshop 2009 November 17-19, FL2, Boulder Colorado

2 Types of climate and climate-related information commonly sought Climate statistics ( static descriptions) about a station or area Climate monitoring info, to track variations in climate, variability properties Climate index histories (not direct climate measurements) Time frames: past climate, present or recent climate, future climate Spatial scales: Global to organism scale Measured climate versus proxy climate (T, P versus tree rings, SOI, MEI) Associated environmental measurements: stream temp or flow, chemistry Causative factors leading to observed variations, attribution info Raw (observations) or treated (gridded) data versus interpreted information Research findings, access. ENSO, PDO, Forcings, Decision process, refs & biblio Climate impact information. Direct and indirect effects of climate. No one source can, or does, or will, provide all of these types of information
 or treated (gridded) data versus interpreted information Research findings, access. ENSO, PDO, Forcings, Decision process, refs & biblio Climate impact information.")
3 Tools to track climate variations in the western states NOAA Western Regional Climate Center NOAA National Weather Service Weather Forecast Offices River Forecast Center NOAA ESRL Interactive web pages (the old CDC, Climate Diagnostics Center) USDA NRCS Water and Climate Center (Portland Oregon) NOAA NOHRSC National Operational Hydromet Remote Sensing Center NOAA Climate Prediction Center NOAA National Climatic Data Center Drought Portal (drought.gov) NOAA RISAs (Regional Integrated Sciences and Assessments) State sources

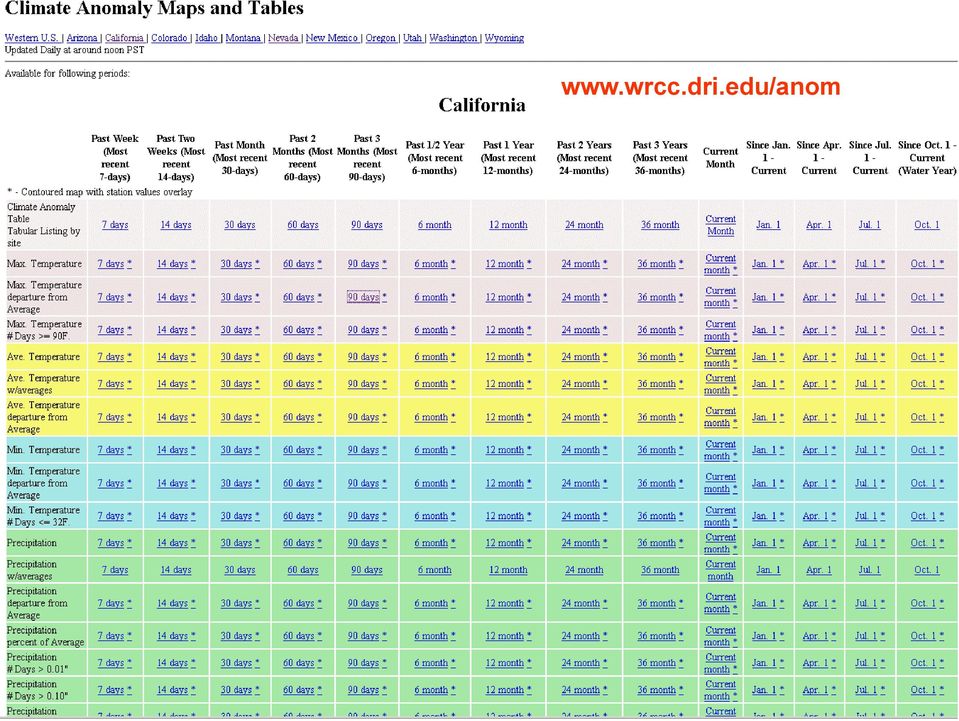
4 WRCC tools to track climate variations in the western states Individual station listings (available for each historical location) (monthly) California Climate Tracker (updated first date of each month) Would be a very good idea to do this for all western states Westmap (updated monthly, but need to keep PRISM operational) National scale RCC ACIS Maps (updated daily) WRCC ACIS maps (expanded set for the West) (updated daily) WRCC Divisional Data Plotter (updated monthly) SPI Visualizer and Data Plotter (updated monthly) CalClim web pages for California (updated daily) Various drought descriptors under development North American Freezing Level Tracker (updated monthly, later daily) ---- In development or needing development Global Reanalysis and North American Regional Reanalysis gridded tools A climate-change compatible PRISM time series, continuously updated Consistent upgrade badly needed Nothing else comes close A number of methodological and administrative issues to address WRCC is willing to take a lead on this Much better information needed on climate forcings for the region Tighter links to attribution
 ---- In development or needing development Global Reanalysis and North American Regional Reanalysis")
5

6

7

8

9

10 Typical NWS cooperative station. Individual daily listings not available via web. 1. Dealing with demand. 2. Agreement among RCCs 3. Some exceptions (CA, for example) Monthly and annual listings are available. Similar summary info available for all us via
 Monthly and annual listings are")
11 HCN-M Historical Climatology Network - Modernized

12

13 Projects

14 As of Nov 2009 About 2000 RAWS stations available. (active plus Inactive)
")
15

16

17
18 Monthly Tmax to date Monthly Tmin to date

19

20

21
22
23 NCDC Climate Divisions
24
25
26
27 California Drought
28
29
30
31
32
33
34
35
36
37 Westmap Joint project between U Arizona DRI / WRCC OSU PRISM Grp NOAA NCTP (now TRACS) CLIMAS /WRCC CAP At present is restricted to just the western United States
38 Areas: States Counties Hydrobasins Climate Divisions Grid squares Individual Pixels Uses 4 km PRISM Monthly Data 1895 through the latest month
39 Precipitation. Water Year (Oct-Sep) Thru Mean:
40 Precipitation. Winter (Nov-Apr) Thru Mean:
41 Precipitation. Year-to-date (Jan-Sep) 1895 Thru 2009 Mean:
42 Temperature Annual
43 Maximum Annual Temperature Minimum
44
45 Select type of product, set up display parameters, select location for time series or domain for map. ( *** Not quite ready for prime time via web yet, but close *** ) Time Series Monthly Fixed temperature Fixed height Pct precip as snow Daily Fixed temperature Fixed height Maps Monthly / Daily Fixed temperature. Mean / departure Fixed height Mean / departure Product Setup Graph parameters Period / duration Color scheme Absolute vs departure
46 Select: Lake Tahoe area, 12 months ending in Dec, Temperature 0 C, 9-year running mean.
47 Elevation of Freezing Level over Lake Tahoe. Annual through 2008.
48 Elevation of Freezing Level over Lake Tahoe. Spring thru 2009.
49 Elevation of Freezing Level over Lake Tahoe. Summer thru 2009.
50 Select central Yellowstone National Park.
51 Elevation of Freezing Level over Yellowstone Lake. September thru 2009.
52 Mean Freezing Level Height Departure over North America. September Reference Period
53 Select Upper Colorado River Basin
54 Elevation of Freezing Level over Upper Colorado Basin. March. From NCEP Reanalysis.
55 Elevation of Freezing Level over Upper Colorado River Basin. Spring. From NCEP Reanalysis.
56 Elevation of Freezing Level over Northern Idaho. 365 Days into mid-october Climatology : black line median and blue percentiles.
57 Select: Lake Tahoe area, 12 months ending in Jan, Temperature 0 C, 9-year running mean.
58 Percent of Cool Season Precipitation Falling with Freezing Level Below 2000 m (6562 ft). Larger fraction implies more precipitation as snow, less as rain. Lake Tahoe NCEP Reanalysis Precipitation and Temperature.
59 Percent of Winter Precipitation Falling with Freezing Level Below 2000 m (6562 ft). Larger fraction implies more precipitation as snow, less as rain. Lake Tahoe NCEP Reanalysis Precipitation and Temperature.
60 Percent of Jan-Mar Precipitation Falling with Freezing Level Below 2000 m (6562 ft). Larger fraction implies more precipitation as snow, less as rain. Lake Tahoe NCEP Reanalysis Precipitation and Temperature.
61 Percent of Spring Precipitation Falling with Freezing Level Below 2000 m (6562 ft). Larger fraction implies more precipitation as snow, less as rain. Lake Tahoe NCEP Reanalysis Precipitation and Temperature.
62 Trend in Annual Freezing Level Height thru meters/decade
63 Trend in January-May Freezing Level Height thru meters/decade
64 Trend in Annual Freezing Level Height thru meters/decade
65 Trend at 1600 m elevation in Precipitation falling with Temperature below freezing , January thru May. Units: percent per decade.
66 20 February 2007
67 White Mtn Summit, ft Reconfigured July 2004
68 White Mountain Summit Temperature. 14,245 feet. Reconstructed from Global Reanalysis. 99 % of NARR-derived temperatures are within +/- 3 Deg C. Mean Annual Temperature Trend 0.24 C/decade, 30% greater than California Statewide. Trends greatest above 6000 feet. Freezing level In spring: trend ft/decade 52 m/decade Days with Mean Daily Temperature Above Freezing ( 0 C ) John Abatzoglou Kelly Redmond
69 Mt Warren Summit Station 12,327 ft
70
71
72 Precipitation Water Year 2009 Oct 01 Thru Nov 14
73 Precipitation Water Year 2009 Oct 01 Thru Nov 14
74 Precipitation Pct of Ave thru 2009 Nov 14 6-month 12-month 24-month 36-month
75 Temperature Water Year 2009 Oct 01 Nov 14
76 Temperature Last 14 days 2009 Nov 01-14
77
78 The World s Warm Oceans
79 Redmond & Koch, 1991, updated. Washington Redmond & Koch, 1991, updated. ENSO Arizona Central Sierra
80 Sea Surface Temperatures Departure from Average Nov 1-7. NOAA ESRL PSD Map Room
81 National Snow and Ice Data Center
82 Interactive Plotting Analyses 1/3
83 Interactive Plotting Analyses 2/3
84 Interactive Plotting Analyses 3/3
85 Climate Prediction Center. noaa.gov
86 Precipitation CPC 3-Month Outlooks Temperature
87 365 days thru 12 Nov Barrow Temp and Hilo Precip.
88 1 day USA Tmax/Tmin/Departures thru 2009 Nov days
89 National Weather Service (NWS) Weather Forecast Offices (WFOs)
90 NWS Daily Updates and Archives Daily Summaries, F-6, State/Reg Tables
91

92 Sep 28, 1999 Sep 26, 2000 Sep 25, 2001 Sep 24, 2002 Sep 30, 2003 Sep 21, 2004
93 Sep 27, 2005 Sep 26, 2006 Sep 25, 2007 Sep 30, 2008 Sep 29, 2009 Nov 10, 2009
94 Monitoring page one of many
95
96 NRCS Snotel Program Approximately 750 sites in US Most are hourly to 3 hourly Updated continuously Approx 1980 start for most stations

97 Western Basins Snow Water Content from Snotel Stations Percent of Average 2009 May 02 Above L Powell 83%

98 History of Atmospheric Forcings Warming Hansen et al, Earth's energy imbalance: Confirmation and implications. Science, 308, Cooling Radiative Factors that Control Global Climate
99 T (C) Annual Winter Summer IPCC 2007 Late 21st P (%) Agree? Thanks to Phil Mote
100 Average of 19 climate models Figure by Gabriel Vecchi. es/div/ocp/drought/scienc e.shtml R. Seager, M.F. Ting, I.M. Held, Y. Kushnir, J. Lu, G. Vecchi, H.-P. Huang, N. Harnik, A. Leetmaa, N.-C. Lau, C. Li, J. Velez, N. Naik, Model Projections of an Imminent Transition to a More Arid Climate in Southwestern North America. Science, DOI: /science
101 Global Climate Change Impacts in the United States TR Karl, JM Melillo, TC Peterson (eds). Cambridge University Press. 189 pp.
102 Global Climate Change Impacts in the United States TR Karl, JM Melillo, TC Peterson (eds). Cambridge University Press. 189 pp.
103 Annual Winter Spring Summer Autumn East Central Nevada Projected Temperature Changes ( C ) 15 Models IPCC A1B Early 21 st Middle 21 st Late 21 st John Abatzoglou
104 East Central Nevada Projected Precipitation Changes ( % ) Early 21 st Middle 21 st Late 21 st Annual Winter Spring Summer Autumn
105 Thru Dec 2008 NOAA National Climatic Data Center
106 Annual Mean Temperature ( F ) 53 Western United States (11 states) Annual Jan-Dec Temperature Provisional data from NCDC / CPC. Blue: 11-year running mean. Units: Deg F. Data source NOAA cooperative network, thru Dec Year Western Regional Climate Center
107 Winter Spring Summer Autumn Annual Annual Temperature Trend National Temperature Trend by Season The Last 30 Years

108 (Oct) United States Annual Temperature Departure from Mean NOAA Divisional Data, Western Regional Climate Center, Plotted by ESRL PSD
109 Water Year Precipitation ( inches ) Western United States (11 states) Water Year (Oct-Sep) Precipitation. Provisional data from NCDC / CPC. Blue: 11-year running mean. Units: Inches. Data source NOAA cooperative network, thru Dec End Year Western Regional Climate Center
110 Global Climate Change Impacts in the United States TR Karl, JM Melillo, TC Peterson (eds). Cambridge University Press. 189 pp.
111 EOF 1 5 EOF 1 Time Series % Run C. Blue Oak Running Mean: Green - 7 Years, Blue - 15 Years Year
112 Lessons from History. Colorado River Flow. Lees Ferry. Reconstructed 762 thru 2005 A.D. Red: Gauged record. Blue: Reconstructed record. 20-Year moving averages. Meko, D.M., C.A. Woodhouse, C.H. Baisan, T. Knight, J.J. Lukas, M.K. Hughes, and M.W. Salzer, Medieval drought in the upper Colorado River basin. Geophysical Research Letters 34m L10705, doi: /2007GL029988
113 ? Is the current Southwest drought a once-or-twice-a-century drought like those of the past 500 years? or? a harbinger of things to come, a different type of drought that we have not observed before??
114
115
116 Coop stations with long enough record to summarize temperature (~5 years) WRCC Summary Graphics
117
118 Updated by John Abatzoglou
119 John Abatzoglou, Kelly Redmond, Laura Edwards. Classification of regional climate variability in the state of California. 2009, Journal of Applied Meteorology and Climatology, 48(8), DOI: /2009JAMC2062.1
120

121 Mean California Statewide Temperature Water Year Thru
122 Maximum Temp California Statewide Water Year Minimum Temp thru
123 Water Year Oct-Sep Precip Sierra Nevada 1895/96 thru 2008/09

124 Water Year Oct-Sep Precip South Coastal California 1895/96 thru 2008/09

125 Sierra Nevada Temperature and Precipitation Oct 2007 Thru Sep 2008 A possible analog for climate change? California Climate Tracker Sierra Nevada 12 Months Ending End of Sep 2009
126 Sierra Nevada Winter Precipitation DJF Thru
127 Sierra Nevada Spring Precipitation MAM 1895 Thru 2009
128
129
130
131
132
133
134
135 cdec.water.ca.gov/cgi-progs/snowsurvey_p/plot_esi

136 June 15, 2009 Snowpack Conditions North Central South
137
138 Side note PRISM Monthly Time Series Data Very widely used (including for Westmap) A critical data set for mountain environments In great demand In jeopardy of being lost Spatial Climate Mapping Consortium has been formed Steering and guidance mechanism Short term and long term goals Advocacy group for fine scale surface spatial climate data A needed capability as part of a national climate service See me if interested
139 Concluding notes There is a huge amount of material accessible via the web. Also a huge demand exists for such data and information. Way too much to describe each item or set of web pages. Much of this is useful, even very useful, but still: user beware. Fair amount of overlap in web accessible information, but Differences in style and readability Differences in ability to summarize as desired More info on elements beyond Temp/Precip desired Wind, solar, humidity, etc Would be nice to have a national system for obtaining daily data Gridded versus point data We d like to make use of more gridded data (eg, PRISM) But, each gridded data set needs to be vetted by users Fundamental issue: Need to be able to resolve mountains One-stop or Few-stop Shopping frequently requested Climate portal often discussed So much exists, changing so fast, can only partially achieve this goal
140 Bishop Creek, CA Thank You
141 Discards
Section 5 CLIMATE TABLES
 Section Section CLIMATE SOURCES OF DATA... -1 HISTORICAL CONTEXT... -1 PRECIPITATION... -2 TEMPERATURES... -3 EVAPOTRANSPIRATION... -3 WIND SPEED AND DIRECTION... -4 DEGREE DAYS...-4 CONCLUSIONS AND RECOMMENDATIONS...
Climate Change. Lauma M. Jurkevics - DWR, Southern Region Senior Environmental Scientist
 Climate Change A n o t h e r F a c t o r i n M a n a g i n g S o u t h e r n C a l i f o r n i a s W a t e r R e s o u r c e s Lauma M. Jurkevics - DWR, Southern Region Senior Environmental Scientist USEPA-Region
Climate, Drought, and Change Michael Anderson State Climatologist. Managing Drought Public Policy Institute of California January 12, 2015
 Climate, Drought, and Change Michael Anderson State Climatologist Managing Drought Public Policy Institute of California January 12, 2015 Oroville Reservoir January 2009 Presentation Overview The Rules
LAURA M. EDWARDS. EDUCATION M.S. Meteorology University of Maryland 2003 B.A. Physics and French University of Minnesota 1999
 LAURA M. EDWARDS SDSU Extension and Division of Atmospheric Sciences Desert Research Institute 13 2 nd Ave SE Aberdeen, SD 57401 (605) 626-2870 laura.edwards@sdstate.edu EDUCATION M.S. Meteorology University
Climatography of the United States No. 20 1971-2000
 Climate Division: CA 4 NWS Call Sign: Month (1) Min (2) Month(1) Extremes Lowest (2) Temperature ( F) Lowest Month(1) Degree s (1) Base Temp 65 Heating Cooling 1 Number of s (3) Jan 59.3 41.7 5.5 79 1962
Climatography of the United States No. 20 1971-2000
 Climate Division: CA 6 NWS Call Sign: SAN Month (1) Min (2) Month(1) Extremes Lowest (2) Temperature ( F) Lowest Month(1) Degree s (1) Base Temp 65 Heating Cooling 100 Number of s (3) Jan 65.8 49.7 57.8
Climatography of the United States No. 20 1971-2000
 Climate Division: CA 2 NWS Call Sign: SAC Month (1) Min (2) Month(1) Extremes Lowest (2) Temperature ( F) Lowest Month(1) Degree s (1) Base Temp 65 Heating Cooling 100 Number of s (3) Jan 53.8 38.8 46.3
Water Year 2001 in Northern California: Have the Good Years Ended?
 Water Year 21 in Northern California: Have the Good Years Ended? Maurice Roos Abstract For the second water season in a row, precipitation and snowpack accumulation from October through December were far
Mixing Heights & Smoke Dispersion. Casey Sullivan Meteorologist/Forecaster National Weather Service Chicago
 Mixing Heights & Smoke Dispersion Casey Sullivan Meteorologist/Forecaster National Weather Service Chicago Brief Introduction Fire Weather Program Manager Liaison between the NWS Chicago office and local
Introduction to Raster Graphics and Applications
 Data Visualization Workshop May 7, 2015 Introduction to Raster Graphics and Applications Richard Koehler, PhD, PH NOAA, Boulder, CO richard.koehler@noaa.gov Source: usgs.gov Source: nrcs.gov Source: noaa.gov
ENSO: Recent Evolution, Current Status and Predictions. Update prepared by: Climate Prediction Center / NCEP 29 June 2015
 ENSO: Recent Evolution, Current Status and Predictions Update prepared by: Climate Prediction Center / NCEP 29 June 2015 Outline Summary Recent Evolution and Current Conditions Oceanic Niño Index (ONI)
The NIDIS Pilot in the Upper Colorado River Basin
 The NIDIS Pilot in the Upper Colorado River Basin Jim Verdin (USGS), Roger Pulwarty (NOAA), Nolan Doesken (CSU), Mike Gillespie (NRCS), Kevin Werner (NOAA), Olga Wilhelmi (NCAR), Michael Lewis (USGS),
Great Plains and Midwest Climate Outlook 19 March 2015
 Great Plains and Midwest Climate Outlook 19 March 2015 Wendy Ryan Assistant State Climatologist Colorado State University wendy.ryan@colostate.edu Grass fire in SE Nebraska 13 March 2015 General Information
FLOOD FORECASTING PRACTICE IN NORTHERN CALIFORNIA
 FLOOD FORECASTING PRACTICE IN NORTHERN CALIFORNIA California Department of Water Resources Post Office Box 219000, Sacramento, California 95821 9000 USA By Maurice Roos, Chief Hydrologist ABSTRACT Although
The National Integrated Drought Information System. The NIDIS Implementation Team www.drought.gov
 The National Integrated Drought Information System The NIDIS Implementation Team www.drought.gov National Integrated Drought Information System No systematic collection and analysis of social, environmental,
Southern AER Atmospheric Education Resource
 Southern AER Atmospheric Education Resource Vol. 9 No. 5 Spring 2003 Editor: Lauren Bell In this issue: g Climate Creations exploring mother nature s remote control for weather and Climate. g Crazy Climate
Climate Extremes Research: Recent Findings and New Direc8ons
 Climate Extremes Research: Recent Findings and New Direc8ons Kenneth Kunkel NOAA Cooperative Institute for Climate and Satellites North Carolina State University and National Climatic Data Center h#p://assessment.globalchange.gov
Armenian State Hydrometeorological and Monitoring Service
 Armenian State Hydrometeorological and Monitoring Service Offenbach 1 Armenia: IN BRIEF Armenia is located in Southern Caucasus region, bordering with Iran, Azerbaijan, Georgia and Turkey. The total territory
Development of an Integrated Data Product for Hawaii Climate
 Development of an Integrated Data Product for Hawaii Climate Jan Hafner, Shang-Ping Xie (PI)(IPRC/SOEST U. of Hawaii) Yi-Leng Chen (Co-I) (Meteorology Dept. Univ. of Hawaii) contribution Georgette Holmes
DoD Interest in Seasonal & Sub-seasonal Climate Prediction
 DoD Interest in Seasonal & Sub-seasonal Climate Prediction Maj Ryan Harris Director of Operations 14th Weather Squadron Asheville, NC Approved for Public Release Distribution Unlimited 31 March 2015 Overview
Geography affects climate.
 KEY CONCEPT Climate is a long-term weather pattern. BEFORE, you learned The Sun s energy heats Earth s surface unevenly The atmosphere s temperature changes with altitude Oceans affect wind flow NOW, you
The European (RA VI) Regional Climate Centre Node on Climate Monitoring
 Regional Climate Centre Node on Climate Monitoring") The European (RA VI) Regional Climate Centre Node on Climate Monitoring Peter Bissolli Deutscher Wetterdienst, Germany WMO RA VI Regional Climate Centre (RCC) 1 Outline 1. Overview of the Regional Climate
The European (RA VI) Regional Climate Centre Node on Climate Monitoring Peter Bissolli Deutscher Wetterdienst, Germany WMO RA VI Regional Climate Centre (RCC) 1 Outline 1. Overview of the Regional Climate
Arizona Climate Summary February 2015 Summary of conditions for January 2015
 Arizona Climate Summary February 2015 Summary of conditions for January 2015 January 2015 Temperature and Precipitation Summary January 1 st 14 th : January started off with a very strong low pressure
TOPIC: CLOUD CLASSIFICATION
 INDIAN INSTITUTE OF TECHNOLOGY, DELHI DEPARTMENT OF ATMOSPHERIC SCIENCE ASL720: Satellite Meteorology and Remote Sensing TERM PAPER TOPIC: CLOUD CLASSIFICATION Group Members: Anil Kumar (2010ME10649) Mayank
NOAA s National Climatic Data Center
 NOAA s National Climatic Data Center World s Largest Archive of Climate and Weather Data Presented to: Quarterly Meeting, Subcommittee of Hydrology, ACWI 23 October 2014 Dongsoo Kim, Ph.D. Project Scientist
Analysis of Climatic and Environmental Changes Using CLEARS Web-GIS Information-Computational System: Siberia Case Study
 Analysis of Climatic and Environmental Changes Using CLEARS Web-GIS Information-Computational System: Siberia Case Study A G Titov 1,2, E P Gordov 1,2, I G Okladnikov 1,2, T M Shulgina 1 1 Institute of
MIAMI-SOUTH FLORIDA National Weather Service Forecast Office http://www.weather.gov/miami
 MIAMI-SOUTH FLORIDA National Weather Service Forecast Office http://www.weather.gov/miami January Summary: Warm and Dry Winter Rolls On February 1, 2013: South Florida s warm and dry winter pattern of
THE STRATEGIC PLAN OF THE HYDROMETEOROLOGICAL PREDICTION CENTER
 THE STRATEGIC PLAN OF THE HYDROMETEOROLOGICAL PREDICTION CENTER FISCAL YEARS 2012 2016 INTRODUCTION Over the next ten years, the National Weather Service (NWS) of the National Oceanic and Atmospheric Administration
Project Title: Quantifying Uncertainties of High-Resolution WRF Modeling on Downslope Wind Forecasts in the Las Vegas Valley
 University: Florida Institute of Technology Name of University Researcher Preparing Report: Sen Chiao NWS Office: Las Vegas Name of NWS Researcher Preparing Report: Stanley Czyzyk Type of Project (Partners
Radiative effects of clouds, ice sheet and sea ice in the Antarctic
 Snow and fee Covers: Interactions with the Atmosphere and Ecosystems (Proceedings of Yokohama Symposia J2 and J5, July 1993). IAHS Publ. no. 223, 1994. 29 Radiative effects of clouds, ice sheet and sea
GROUNDWATER CONDITIONS
 GROUNDWATER CONDITIONS IN THE NORTHERN SACRAMENTO VALLEY LOCAL MANAGEMENT OF WATER RESOURCES IN THE NORTHERN SACRAMENTO VALLEY MEETING DECEMBER 16, 2011 KELLY STATON, SENIOR ENGINEERING GEOLOGIST, GROUNDWATER
By Dr. Michael J. Hayes, Climate Impacts Specialist, National Drought Mitigation Center, with Christina Alvord and Jessica Lowrey, WWA
 Drought Indices By Dr. Michael J. Hayes, Climate Impacts Specialist, National Drought Mitigation Center, with Christina Alvord and Jessica Lowrey, WWA This article originally appeared in a longer form
[ Climate Data Collection and Forecasting Element ] An Advanced Monitoring Network In Support of the FloodER Program
![[ Climate Data Collection and Forecasting Element ] An Advanced Monitoring Network In Support of the FloodER Program](/thumbs/33/16326315.jpg "[ Climate Data Collection and Forecasting Element ] An Advanced Monitoring Network In Support of the FloodER Program") [ Climate Data Collection and Forecasting Element ] An Advanced Monitoring Network In Support of the FloodER Program December 2010 1 Introduction Extreme precipitation and the resulting flooding events
[ Climate Data Collection and Forecasting Element ] An Advanced Monitoring Network In Support of the FloodER Program December 2010 1 Introduction Extreme precipitation and the resulting flooding events
RE: James vs. ABC Company Greentown, NJ D/A: February 20, 2011
 PO Box 7100 Hackettstown, NJ 07840 Phone: 1 800 427 3456 Fax: 908-850-8664 http://www.weatherworksinc.com June 16, 2012 Attn: John Doe Law Offices of John Doe 123 Fourth Street Smithtown, NJ 04506 RE:
Estimating Firn Emissivity, from 1994 to1998, at the Ski Hi Automatic Weather Station on the West Antarctic Ice Sheet Using Passive Microwave Data
 Estimating Firn Emissivity, from 1994 to1998, at the Ski Hi Automatic Weather Station on the West Antarctic Ice Sheet Using Passive Microwave Data Mentor: Dr. Malcolm LeCompte Elizabeth City State University
Central Oregon Climate and how it relates to gardening
 Central Oregon Climate and how it relates to gardening Garden Note #1 Amy Jo Detweiler Horticulture Faculty Rev. July 2009 Behind the beauty of the High Desert landscape lies many factors that create challenges
Colorado Water Supply Outlook Report February 1, 2016
 Colorado Water Supply Outlook Report February 1, 216 Snow surveyors Jerry Archuleta and Sterling Moss explain the workings of the Upper San Juan SNOTEL site to a group of high school students from Pagosa
WEATHER AND CLIMATE practice test
 WEATHER AND CLIMATE practice test Multiple Choice Identify the choice that best completes the statement or answers the question. 1. What role does runoff play in the water cycle? a. It is the process in
ENSO Cycle: Recent Evolution, Current Status and Predictions. Update prepared by Climate Prediction Center / NCEP 9 May 2011
 ENSO Cycle: Recent Evolution, Current Status and Predictions Update prepared by Climate Prediction Center / NCEP 9 May 2011 Outline Overview Recent Evolution and Current Conditions Oceanic Niño Index (ONI)
Studying Topography, Orographic Rainfall, and Ecosystems (STORE)
") Studying Topography, Orographic Rainfall, and Ecosystems (STORE) Basic Lesson 3: Using Microsoft Excel to Analyze Weather Data: Topography and Temperature Introduction This lesson uses NCDC data to compare
Studying Topography, Orographic Rainfall, and Ecosystems (STORE) Basic Lesson 3: Using Microsoft Excel to Analyze Weather Data: Topography and Temperature Introduction This lesson uses NCDC data to compare
2013 Annual Climate Summary for the Southeast United States
 Months of heavy rain forced the U.S. Army Corp of Engineers to open the spillways at Lake Hartwell, located at the headwaters of the Savannah River along the South Carolina-Georgia border, on July 9,.
The State of the Climate And Extreme Weather. Deke Arndt NOAA s National Climatic Data Center
 The State of the Climate And Extreme Weather Deke Arndt June Feb 2013 2011 1 The world s largest archive of weather and climate data NCDC is located in Asheville, North Carolina A place of active retirement
Fundamentals of Climate Change (PCC 587): Water Vapor
: Water Vapor") Fundamentals of Climate Change (PCC 587): Water Vapor DARGAN M. W. FRIERSON UNIVERSITY OF WASHINGTON, DEPARTMENT OF ATMOSPHERIC SCIENCES DAY 2: 9/30/13 Water Water is a remarkable molecule Water vapor
Fundamentals of Climate Change (PCC 587): Water Vapor DARGAN M. W. FRIERSON UNIVERSITY OF WASHINGTON, DEPARTMENT OF ATMOSPHERIC SCIENCES DAY 2: 9/30/13 Water Water is a remarkable molecule Water vapor
Analysis of the Western U.S. Winter Storm 3-7 January 2008: Part 1 - Correlating Normalized Anomalies with High Impact Weather and Event Rarity
 National Weather Association, Electronic Journal of Operational Meteorology, 2009-EJ9 Analysis of the Western U.S. Winter Storm 3-7 January 2008: Part 1 - Correlating Normalized Anomalies with High Impact
Guy Carpenter Asia-Pacific Climate Impact Centre, School of energy and Environment, City University of Hong Kong
 Diurnal and Semi-diurnal Variations of Rainfall in Southeast China Judy Huang and Johnny Chan Guy Carpenter Asia-Pacific Climate Impact Centre School of Energy and Environment City University of Hong Kong
Monsoon Variability and Extreme Weather Events
 Monsoon Variability and Extreme Weather Events M Rajeevan National Climate Centre India Meteorological Department Pune 411 005 rajeevan@imdpune.gov.in Outline of the presentation Monsoon rainfall Variability
2015 Climate Review for Puerto Rico and the U.S. Virgin Islands. Odalys Martínez-Sánchez
 2015 Climate Review for Puerto Rico and the U.S. Virgin Islands. Odalys Martínez-Sánchez 2015 can be described as a dry and hot year across Puerto Rico (PR) and the U.S. Virgin Islands (USVI). Below normal
Anyone Else Notice That Its Been Windy Lately?
 National Weather Service Aberdeen, South Dakota January 2014 Inside this issue: Has it Been Windy Lately or What? 2013 Year in Review 2013 Year in Review (cont.) 1 2 3 Has it Been Windy Lately or What?
Jessica Blunden, Ph.D., Scientist, ERT Inc., Climate Monitoring Branch, NOAA s National Climatic Data Center
 Kathryn Sullivan, Ph.D, Acting Under Secretary of Commerce for Oceans and Atmosphere and NOAA Administrator Thomas R. Karl, L.H.D., Director,, and Chair of the Subcommittee on Global Change Research Jessica
Real-time Ocean Forecasting Needs at NCEP National Weather Service
 Real-time Ocean Forecasting Needs at NCEP National Weather Service D.B. Rao NCEP Environmental Modeling Center December, 2005 HYCOM Annual Meeting, Miami, FL COMMERCE ENVIRONMENT STATE/LOCAL PLANNING HEALTH
weather information management system / remote automated weather station
 weather information management system / remote automated weather station (wims/raws) OpERATIONS GUIDE wyoming blm June 2010 Table of Contents INTRODUCTION... ROLES AND RESPONSIBILITIES... A. District Manager...
Very High Resolution Arctic System Reanalysis for 2000-2011
 Very High Resolution Arctic System Reanalysis for 2000-2011 David H. Bromwich, Lesheng Bai,, Keith Hines, and Sheng-Hung Wang Polar Meteorology Group, Byrd Polar Research Center The Ohio State University
Flash Flood Guidance Systems
 Flash Flood Guidance Systems Introduction The Flash Flood Guidance System (FFGS) was designed and developed by the Hydrologic Research Center a non-profit public benefit corporation located in of San Diego,
2. The map below shows high-pressure and low-pressure weather systems in the United States.
 1. Which weather instrument has most improved the accuracy of weather forecasts over the past 40 years? 1) thermometer 3) weather satellite 2) sling psychrometer 4) weather balloon 6. Wind velocity is
Basic Climatological Station Metadata Current status. Metadata compiled: 30 JAN 2008. Synoptic Network, Reference Climate Stations
 Station: CAPE OTWAY LIGHTHOUSE Bureau of Meteorology station number: Bureau of Meteorology district name: West Coast State: VIC World Meteorological Organization number: Identification: YCTY Basic Climatological
Project Title: Implementing the Hydroclimatic Index in Short- and Long- Term Drought Forecasting within the Colorado River Basin
 Final Report Project Title: Implementing the Hydroclimatic Index in Short- and Long- Term Drought Forecasting within the Colorado River Basin Project Period: 6/4/2007 through 8/31/2010 PI: Andrew W. Ellis
Deke Arndt Climate Monitoring Branch Na6onal Clima6c Data Center 25 June 2013
 Deke Arndt Climate Monitoring Branch Na6onal Clima6c Data Center 25 June 2013 The National Climatic Data Center The World s Largest Archive of Weather & Climate Data NCDC is located in Asheville, North
NOAA to Provide Enhanced Frost Forecast Information to Improve Russian River Water Management
 NOAA to Provide Enhanced Frost Forecast Information to Improve Russian River Water Management David W. Reynolds Meteorologist in Charge (Retired) National Weather Service Forecast Office San Francisco
Graphing Sea Ice Extent in the Arctic and Antarctic
 Graphing Sea Ice Extent in the Arctic and Antarctic Summary: Students graph sea ice extent (area) in both polar regions (Arctic and Antarctic) over a three-year period to learn about seasonal variations
SECTION 3.2 CLIMATE AND PRECIPITATION
 SECTION 3.2 CLIMATE AND PRECIPITATION Ulster County Climate Data A preliminary analysis of the Preserve s weather data shows that the average temperature has risen about two degrees over the past 114 years.
High resolution modeling of climate processes in diverse landscapes. James M. Byrne Professor and Chair of Geography University of Lethbridge
 High resolution modeling of climate processes in diverse landscapes James M. Byrne Professor and Chair of Geography University of Lethbridge Climate Change and Extremes Workshop 16-17 October 2003, Victoria,
How To Understand Cloud Radiative Effects
 A Climatology of Surface Radiation, Cloud Cover, and Cloud Radiative Effects for the ARM Tropical Western Pacific Sites. Chuck Long, Casey Burleyson, Jennifer Comstock, Zhe Feng September 11, 2014 Presented
CE394K GIS IN WATER RESOURCES TERM PROJECT REPORT
 CE394K GIS IN WATER RESOURCES TERM PROJECT REPORT Soil Water Balance in Southern California Cheng-Wei Yu Environmental and Water Resources Engineering Program Introduction Historical Drought Condition
Studying Topography, Orographic Rainfall, and Ecosystems (STORE)
") Studying Topography, Orographic Rainfall, and Ecosystems (STORE) Introduction Basic Lesson 2: Using ArcGIS Explorer to Analyze the Connection between Topography and Rainfall This lesson introduces Geographical
Studying Topography, Orographic Rainfall, and Ecosystems (STORE) Introduction Basic Lesson 2: Using ArcGIS Explorer to Analyze the Connection between Topography and Rainfall This lesson introduces Geographical
A Synthesis to Support Water Resources Management and Adaptation A R EP O RT F O R T H E C O L O R AD O WAT ER C O NS ERVAT IO N B OAR D
 Climate Change in Colorado A Synthesis to Support Water Resources Management and Adaptation A R EP O RT F O R T H E C O L O R AD O WAT ER C O NS ERVAT IO N B OAR D Climate Change in Colorado A Synthesis
Tools from the US EPA s Climate Ready Water Utilities Initiative (CRWU) EPA Region 3 Conference Extreme Weather Events: Adapt, Mitigate, and Survive
 EPA Region 3 Conference Extreme Weather Events: Adapt, Mitigate, and Survive") Tools from the US EPA s Climate Ready Water Utilities Initiative (CRWU) EPA Region 3 Conference Extreme Weather Events: Adapt, Mitigate, and Survive May 9, 2013 1 Presentation Overview Background on EPA
Tools from the US EPA s Climate Ready Water Utilities Initiative (CRWU) EPA Region 3 Conference Extreme Weather Events: Adapt, Mitigate, and Survive May 9, 2013 1 Presentation Overview Background on EPA
REGIONAL CLIMATE AND DOWNSCALING
 REGIONAL CLIMATE AND DOWNSCALING Regional Climate Modelling at the Hungarian Meteorological Service ANDRÁS HORÁNYI (horanyi( horanyi.a@.a@met.hu) Special thanks: : Gabriella Csima,, Péter Szabó, Gabriella
Climate Change on the Prairie:
 Climate Change on the Prairie: A Basic Guide to Climate Change in the High Plains Region - UPDATE Global Climate Change Why does the climate change? The Earth s climate has changed throughout history and
NCDC Strategic Vision
 NOAA s National Climatic Data Center World s Largest Archive of Climate and Weather Data Presented to: Coastal Environmental Disasters Data Management Workshop September 16, 2014 Stephen Del Greco Deputy
Impact of Warming on Outflows from Selected Upper Watersheds in California
 Impact of Warming on Outflows from Selected Upper Watersheds in California Guobiao Huang (CA DWR), Tariq Kadir (CA DWR) and Francis Chung (CA DWR) California Water and Environmental Modeling Forum Pacific
Managing Extreme Weather at Transport for London. ARCC Assembly - 12 June 2014 Helen Woolston, Transport for London Sustainability Coordinator
 Managing Extreme Weather at Transport for London ARCC Assembly - 12 June 2014 Helen Woolston, Transport for London Sustainability Coordinator Slide list (wont show) Long Term Climate Change 1. What TfL
7.10 INCORPORATING HYDROCLIMATIC VARIABILITY IN RESERVOIR MANAGEMENT AT FOLSOM LAKE, CALIFORNIA
 7.10 INCORPORATING HYDROCLIMATIC VARIABILITY IN RESERVOIR MANAGEMENT AT FOLSOM LAKE, CALIFORNIA Theresa M. Carpenter 1, Konstantine P. Georgakakos 1,2, Nicholas E. Graham 1,2, Aris P. Georgakakos 3,4,
The Climate of Oregon Climate Zone 2 Willamette Valley
 /05 E-55 No. ci oi Unbound issue e2_, Does not circulate Special Report 914 May 1993 The Climate of Oregon Climate Zone 2 Property of OREGON STATE UNIVERSITY Library Serials Corvallis, OR 97331-4503 Agricultural
Current climate change scenarios and risks of extreme events for Northern Europe
 Current climate change scenarios and risks of extreme events for Northern Europe Kirsti Jylhä Climate Research Finnish Meteorological Institute (FMI) Network of Climate Change Risks on Forests (FoRisk)
MIAMI-SOUTH FLORIDA National Weather Service Forecast Office http://www.weather.gov/miami
 MIAMI-SOUTH FLORIDA National Weather Service Forecast Office http://www.weather.gov/miami November 2014 Weather Summary Cooler and Drier than Normal December 1, 2014: Cooler than normal temperatures was
SPATIAL DISTRIBUTION OF NORTHERN HEMISPHERE WINTER TEMPERATURES OVER THE SOLAR CYCLE DURING THE LAST 130 YEARS
 SPATIAL DISTRIBUTION OF NORTHERN HEMISPHERE WINTER TEMPERATURES OVER THE SOLAR CYCLE DURING THE LAST 130 YEARS Kalevi Mursula, Ville Maliniemi, Timo Asikainen ReSoLVE Centre of Excellence Department of
Scheduling Best Practices
 The eighth article in the Scheduling Best Practices series is How to Handle the Weather. Our colleague Beth Blair, a managing consultant in Warner s Disputes Resolution Group, has over 20 years of experience
South Africa. General Climate. UNDP Climate Change Country Profiles. A. Karmalkar 1, C. McSweeney 1, M. New 1,2 and G. Lizcano 1
 UNDP Climate Change Country Profiles South Africa A. Karmalkar 1, C. McSweeney 1, M. New 1,2 and G. Lizcano 1 1. School of Geography and Environment, University of Oxford. 2. Tyndall Centre for Climate
MIAMI-SOUTH FLORIDA National Weather Service Forecast Office http://www.weather.gov/miami
 MIAMI-SOUTH FLORIDA National Weather Service Forecast Office http://www.weather.gov/miami Summer 2015 Weather Summary Wet West and Dry East September 2, 2015: One of the most variable summers in recent
An Investigation of Potential Hydrologic and Management Impacts on the Bull Run System
 The Impacts of Climate Change on Portland's Water Supply: An Investigation of Potential Hydrologic and Management Impacts on the Bull Run System Dr. Richard N. Palmer and Margaret Hahn Department of Civil
Temporal variation in snow cover over sea ice in Antarctica using AMSR-E data product
 Temporal variation in snow cover over sea ice in Antarctica using AMSR-E data product Michael J. Lewis Ph.D. Student, Department of Earth and Environmental Science University of Texas at San Antonio ABSTRACT
Boulder Creek Critical Zone Observatory Data Management Plan
 Boulder Creek Critical Zone Observatory Data Management Plan Types of data The Boulder Creek Critical Zone Observatory (CZO) focuses on research in the Boulder Creek watershed. This encompasses Green Lakes
Scholar: Elaina R. Barta. NOAA Mission Goal: Climate Adaptation and Mitigation
 Development of Data Visualization Tools in Support of Quality Control of Temperature Variability in the Equatorial Pacific Observed by the Tropical Atmosphere Ocean Data Buoy Array Abstract Scholar: Elaina
A Project to Create Bias-Corrected Marine Climate Observations from ICOADS
 A Project to Create Bias-Corrected Marine Climate Observations from ICOADS Shawn R. Smith 1, Mark A. Bourassa 1, Scott Woodruff 2, Steve Worley 3, Elizabeth Kent 4, Simon Josey 4, Nick Rayner 5, and Richard
WEATHER LIMITATIONS FOR WINTER AND SUMMER TOURISM IN EUROPE. K. Blazejczyk Institute of Geography and Spatial Organization, Polish Academy of Science
 Developments in Tourism Climatology A. Matzarakis, C. R. de Freitas, D. Scott, 27 WEATHER LIMITATIONS FOR WINTER AND SUMMER TOURISM IN EUROPE K. Blazejczyk Institute of Geography and Spatial Organization,
Climate of Illinois Narrative Jim Angel, state climatologist. Introduction. Climatic controls
 Climate of Illinois Narrative Jim Angel, state climatologist Introduction Illinois lies midway between the Continental Divide and the Atlantic Ocean, and the state's southern tip is 500 miles north of
WESTERN WATER ASSESSMENT WHITE PAPER
 WESTERN WATER ASSESSMENT WHITE PAPER Tracking Socioeconomic Impacts of Drought with Rapid Analytics and Dashboards by William R. Travis and Zachary Johnson 2013 Tracking Socioeconomic Impacts of Drought
SWMM-CAT User s Guide
 EPA/600/R-14/428 September 2014 www.epa.gov/research n t SWMM-CAT User s Guide photo photo Office of Research and Development Water Supply and Water Resources Division EPA 600-R-14-428 September 2014 SWMM-CAT
How Do Oceans Affect Weather and Climate?
 How Do Oceans Affect Weather and Climate? In Learning Set 2, you explored how water heats up more slowly than land and also cools off more slowly than land. Weather is caused by events in the atmosphere.
Fire Science Activities 2009 Carl Key, USGS NOROCK
 Fire Science Activities 2009 Carl Key, USGS NOROCK CBI Photo Series and Active Fire Gallery Monitoring Trends in Burn Severity Program Climate Impacts on Burn Severity Humm, if that s that, and this is
Online Site-Specific Degree-Day Predictions Using GIS and Climate Map Technologies
 This newsletter is provided as a printable pdf file at http://oregonipm.ippc.orst.edu Online Site-Specific Degree-Day Predictions Using GIS and Climate Map Technologies Leonard Coop and Paul Jepson Integrated
Drought in the Czech Republic in 2015 A preliminary summary
 Drought in the Czech Republic in 2015 A preliminary summary October 2015, Prague DISCLAIMER All data used in this preliminary report are operational and might be a subject of change during quality control.
THE WATER AGENCY, INC. Water Supply Update
 State Water Resources Control Board Suspends the Sacramento River Temperature Plan We all need to be aware that the SWRCB is causing real turmoil with its recent May 29th letter. The temporary grab of
The Pennsylvania Observer
 The Pennsylvania Observer August 3, 2009 July 2009 - Pennsylvania Weather Recap Written by: Dan DePodwin After a cool month of June, some hoped July would bring usual summertime warmth to the state of
Fire Weather Index: from high resolution climatology to Climate Change impact study
 Fire Weather Index: from high resolution climatology to Climate Change impact study International Conference on current knowledge of Climate Change Impacts on Agriculture and Forestry in Europe COST-WMO
THE GEORGIA AUTOMATED ENVIRONMENTAL MONITORING NETWORK: TEN YEARS OF WEATHER INFORMATION FOR WATER RESOURCES MANAGEMENT
 THE GEORGIA AUTOMATED ENVIRONMENTAL MONITORING NETWORK: TEN YEARS OF WEATHER INFORMATION FOR WATER RESOURCES MANAGEMENT Gerrit Hoogenboom, D.D. Coker, J.M. Edenfield, D.M. Evans and C. Fang AUTHORS: Department
SIXTH GRADE WEATHER 1 WEEK LESSON PLANS AND ACTIVITIES
 SIXTH GRADE WEATHER 1 WEEK LESSON PLANS AND ACTIVITIES WATER CYCLE OVERVIEW OF SIXTH GRADE WATER WEEK 1. PRE: Evaluating components of the water cycle. LAB: Experimenting with porosity and permeability.
Idaho Power Company s
 Idaho Power Company s Cloud Seeding Program Shaun Parkinson, PhD, PE Presentation Overview What is cloud seeding? How we know cloud seeding works Perceptions IPC s cloud seeding program Payette Upper Snake
ES 106 Laboratory # 6 MOISTURE IN THE ATMOSPHERE
 ES 106 Laboratory # 6 MOISTURE IN THE ATMOSPHERE 6-1 Introduction By observing, recording, and analyzing weather conditions, meteorologists attempt to define the principles that control the complex interactions