Sea- Surface Temperature and Thermal Stress in the Coral Triangle region
|
|
|
- Brice Fox
- 3 years ago
- Views:
Transcription
1 Sea-surface temperature and thermal stress in the Coral Triangle over the past two decades E. L. Peñaflor *, W. J. Skirving, A. E. Strong, S. F. Heron, L. T. David E.L. Peñaflor and L.T. David Marine Science Institute, University of the Philippines, Diliman, Quezon City, 1101 Philippines *Corresponding author: Tel: (+63-2) Fax: (+63-) W.J. Skirving, A.E. Strong, and S.F. Heron NOAA NESDIS Coral Reef Watch, E/RA31, SSMC1, 1335 East-West Highway, Silver Spring, MD USA Keywords: Coral Triangle, SST, thermal stress, ENSO

2 Abstract Increasing ocean temperature has become one of the major concerns in recent times with reports of various related ecological impacts becoming commonplace. One of the more notable is the increased frequency of mass coral bleaching worldwide. This study focuses on the Coral Triangle region and utilizes the National Oceanic and Atmospheric Administration- Coral Reef Watch (NOAA-CRW) satellite-derived sea surface temperature (SST) and Degree Heating Weeks (DHW) products to investigate changes in the thermal regime of the Coral Triangle waters between 1985 and Results show that during this period, this region s SST has been increasing at an average rate of 0.2 o C/decade. However, warming within this region is not uniform and the waters of the northern and eastern parts of the Coral Triangle are warming fastest. Areas in the eastern part have experienced more thermal stress events and these stress events appear to be more likely during a La Niña. Introduction The Coral Triangle (CT) is the center of the highest coastal marine biodiversity in the world (Allen and Werner 2002). This region, located in the heart of the Indo-Pacific, includes the countries of the Philippines, Indonesia, and Papua New Guinea (Figure 1) and is home to more than 500 species of corals (Green and Mous 2004). Studies have also shown that the waters around Indonesia and the Philippines possess the highest reef fish endemism (Mora et al. 2003) and that the Philippines is also considered the global center of marine fish biodiversity (Carpenter and Springer 2005). As a bio-region, the CT, known also as the East Indies Triangle (Briggs 2005, 2007) and the Indo-Malay-Philippines Archipelago (Carpenter and Springer 2005), has become one of the most important target areas in marine biodiversity research. Reports have shown, however, that species diversity and abundance in many parts of this region have been greatly threatened by both man-made and natural stresses (Burke et al. 2002; Wilkinson 2004). Specifically, studies have highlighted the alarming decline in coral cover in this region (Bruno and Selig 2007; Carpenter et al. 2008). The decline has been attributed to numerous contributing factors (Edinger et al. 1998; Fox et al. 2003) including the effect of increasing sea surface temperature (SST) over recent years (Carpenter et al. 2008). The effect of SST increase has a wide range of effects on the marine ecosystem. Studies have shown that warm temperature anomalies have led to a reduction in primary production and a decrease in fish catch (Barber and Chavez 1986; McGowan et al. 1998). Another visible effect related to elevated SST is the resultant mass coral bleaching and related mortality (Hoegh-Guldberg 1999; Wilkinson 2004), which led to a decline in reef fish population in some areas (Pratchett et al. 2006), and may trigger coral disease outbreaks (Bruno et al. 2007). A pronounced increase in SST and coral bleaching such as that predicted for the coming decades (IPCC 2007; Hoegh-Guldberg et al. 2007) could therefore lead to a significant depletion of the CT s already stressed marine resources. The CT as a whole is known to experience a pronounced increase in SST during phases of ENSO (El Niño Southern Oscillation), which is a fluctuation between unusually warm and cold conditions in the tropical Pacific that typically recur with a period of 2-7 years (McPhaden et al. 2006). A good example of this was during the ENSO when intense warming led to the widespread occurrences of coral bleaching in this region (Wilkinson 1998; Oliver et al. 2009). Bleaching in corals can be triggered when the thermal condition is
 products to investigate changes in the thermal regime of the Coral Triangle waters between 1985 and 2006.")
3 as little as 1 o C higher than the mean summer maximum (Berkelmans and Willis 1999; Jokiel and Brown 2004). In order to monitor the presence of large-scale thermal stress, the National Oceanic and Atmospheric Administration s (NOAA) Coral Reef Watch (CRW) developed a suite of satellite products based on the NOAA 0.5 o (approx. 50km) resolution Advanced Very High Resolution Radiometer (AVHRR) twice-weekly SST product. This CRW suite of satellite products has been successfully used to predict and monitor bleaching events all over the world (Liu et al. 2003; Skirving et al. 2006; Strong et al. 2006). Beyond this near real-time warning of bleaching occurrence, it is important to investigate how the SST and thermal stress has changed through time and space in one of the most ecologically important regions in the world. To date, no study has been published that provides details of the long-term changes in spatial and temporal SST and thermal stress levels for the CT. This paper will use a hindcast version of the NOAA CRW satellite product suite to examine the changes in SST and bleaching-level thermal stress within the Coral Triangle for the period 1985 to Materials and Methods This study utilized the gap-filled, 0.5 o resolution, biweekly SST product developed by the NOAA s CRW over the period This product is based on the AVHRR Pathfinder SST data ( and was derived by CRW mimicking the methodology of the CRW near real-time product (Eakin et al. 2009). The study area was extended beyond the CT boundary (Green and Mous 2004; verified by J.E.N Veron, pers. comm. with WJS) by including a 200-km buffer zone to ensure that the analyses would not suffer from edge effects. Only data from this buffered CT (Figure 1) were included in the study. The SST data were then used to determine annual averages and ranges for the entire region. The annual average maximum and minimum for the entire region were calculated based on monthly SST averages. The trends in SST within the Coral Triangle were also calculated on a pixel by pixel basis by fitting a linear regression to the 22 years of biweekly SST data. Moreover, a spatial clustering of the entire SST data was also performed on the monthly means of each pixel, grouping pixels with similar SST signatures. The clustering made use of a web-based software called Deluxe Integrated System for Clustering Operations ( The clustering was performed based on k- means method, which is a popular clustering algorithm known for its speed and simplicity (Arthur and Vassilvitskii 2007). Several iterations of randomly-seeded runs were performed to determine the consistency of pixel classification. An analysis using 0.5 o resolution HotSpot and Degree Heating Weeks (DHW) was then conducted to determine the thermal stress levels and frequency of bleaching levels of stress within the study area. The HotSpot anomaly, which is computed as the SST minus the maximum of the monthly mean SST climatology, is an index that indicates the current intensity of thermal stress for a given location. DHW, on the other hand, computes the cumulative thermal stress by accumulating HotSpots over a running 12-week period. A full description of these products is presented in Skirving et al. (2006) and Strong et al. (2006). In this analysis, a pixel-by-pixel calculation of the thermal stress frequency and annual thermal stress levels of reef pixels ( ) were determined. The former highlighted areas within the study area with high occurrences of thermal stress events while the latter was used to compare the interannual changes in thermal stress level in reef locations. Data from the World Resources Institute s Reefs at Risk ( were
.")
4 utilized to determine the reef locations within the study area. A mask was then created to select pixels in the satellite products with reef sites, deemed reef-pixels. All reef-pixels were then divided into clusters, as previously defined. The thermal stress level was calculated by determining the maximum DHW of that pixel within the duration of a stress event. A stress event is defined in this study to begin when DHW first has a value greater than 0 and end just before HotSpot goes below the value of 1. The event year is defined as the year when the stress event started. For example, if a stress event of a certain reef-pixel started in 1997 and ended in 1998 then the DHW value will be attributed to For some reef-pixels with multiple stress events in a year, only the event with the highest DHW value was considered. The per-pixel thermal stress frequency, on the other hand, was calculated by counting all the number of events reaching DHW > 0 and DHW > 4. Occurrences of multiple stress events within a year, hence, were considered in this part of the analysis. The ecological impact of the thermal stress at particular DHW values is well established (Skirving et al. 2006; Strong et al. 2006). DHW values greater than zero indicate the existence of thermal stress (regardless of severity) while DHW values of 4 and greater indicate the existence of sufficient thermal stress to produce significant levels of coral bleaching. Results and Discussion The annual averages show that the entire region as a whole has experienced a slight increase in SST (maximum, average, and minimum) since 1985 (Figure 2). This trend seems to have stabilized since There are two noteworthy years. During 1991 the region experienced a drastic decrease in SST as a result of the Mt. Pinatubo eruption in the Philippines. The effects of this cooling are evident for 2-3 years after the eruption. Conversely, the region experienced a dramatic warming in This warming resulted in widespread bleaching for many parts of this region (Wilkinson 1998; ReefBase [ Interestingly, temperatures during 1997 were remarkably low considering the dramatic warming in This seesaw in SST was due to the occurrence of a very strong El Niño in 1997 and a very strong La Niña in The contrasting differences in SST during these years are due to the temperature and geographic extent of the western Pacific warm pool (WPWP, SST > 28 o C) that oscillates during ENSO events (Kawahata and Gupta 2004). This warm pool of surface water, which is normally located in the western equatorial Pacific, spreads eastward as the trade winds in the western and central equatorial Pacific weaken during an El Niño and shifts to the west of average location during a La Niña as trade winds intensify (McPhaden 1999; Kawahata and Gupta 2004). Normally, these easterly trade winds heap up warm surface water in the western Pacific while upwelling cold water occurs on the eastern side (McPhaden 2006). The weakening, or relaxation, of the trade winds during an El Niño leads to an ocean relaxation process, as well, resulting in a shallower thermocline and cooler than normal temperature in the west Pacific and a deeper thermocline and warmer than normal temperature in the east Pacific (Enfield 2001). Consequently, in the CT region, an El Niño has a relative cooling effect while a La Niña is accompanied by warming. The trends in SST within the Coral Triangle show that on average, the region s SST increased at a rate of 0.2 o C/decade from (Figure 3). This value is comparable with the trends in many other tropical seas (Hoegh-Guldberg 1999). The SST trends varied spatially across the region with higher warming rates around the Philippines and north of Irian Jaya and Papua New Guinea, as compared to the southernmost CT areas (below 5 o S) where rates were much lower. Investigating the SST trends in an area can be valuable in

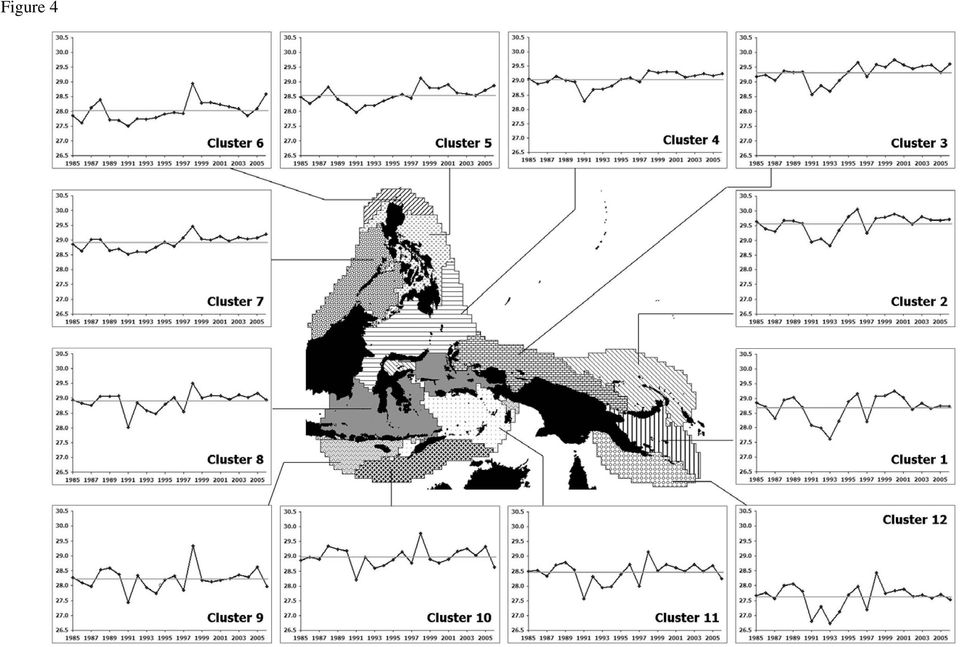
5 explaining the occurrences of mass bleaching events because of the strong correlation between SST and bleaching events (Hoegh-Guldberg 1999). Studies have also shown that a rapid increase in SST has been a major factor in many large-scale coral bleaching occurrences in recent decades (Berkelmans et al. 2004; Lough et al. 2006). Clustering analysis allows further examination of the SST scenarios within the region, and indicated 12 distinct sub-regions (clusters). Annual mean SST s were calculated for each of the clusters to determine the temporal changes in SST of these areas (Figure 4). The majority of the clusters have greater number of warmer-than-average years in the latter 11 years, which explains the SST trends shown in Figure 3. The pronounced increase in SST in 1998 is also evident in many of the clusters. Northern clusters show a consistent positive slope but with less frequent annual fluctuations. Corals located in these areas are more likely to be susceptible to future bleaching unless they develop mechanisms to cope with expected rapid increases in SST. The caveat to this statement is that corals in these areas could also have more time to reestablish due to the infrequency of stress events. The southern clusters, on the other hand, have smaller positive trends in SST but exhibit frequent pronounced fluctuations. The fluctuations may indicate that these areas frequently undergo temperature changes and it is possible that marine organisms in these areas (e.g., corals) have adapted to cope with more variable temperatures (more eurythermal). It has also been pointed out that high variability in temperature may help corals to better acclimate or adapt to an increase in temperature (McClanahan et al. 2007). SST trends, however, are not the whole story as the length of time that corals are exposed to thermal stress is as important as the temperature reached. While the relatively slow SST increase in the southern sub-region could be interpreted to mean that coral reefs in this part of the CT have been subjected to less long-term thermal stress levels than in other areas of the region, this may not necessarily the case. The DHW product provides the metric to investigate trends in thermal stress. An analysis of the thermal stress event frequency in this region (Figure 5) reveals more thermal stress (DHW > 0) events and more occurrences of bleaching-level thermal stress (DHW > 4) during than during Results also indicate the emergence of multiple stress events within a single year (DHW >0) during the latter 11 years. The multiple stress events are most prominent in areas nearest to the WPWP. The WPWP is of particular interest as this part of the Pacific has been shown to have warmed less over the past six decades in comparison to other tropical seas (Kleypas et al. 2008). This suggests a higher sensitivity of the corals in this region to small temperature fluctuations, yet these reefs seem to have a lower proportion of bleaching reports relative to other reefs in the world (Kleypas et al. 2008). Reefs in southeastern Papua New Guinea have experienced a relatively high frequency of thermal stress events but also show lower SST trends and experience more extreme temperature fluctuations that oscillate about a relatively stable mean (Figures 3 and 4, respectively). In contrast, the inner seas of Indonesia have few to no occurrences of significant thermal stress (DHW > 4) even during the latter 11 years. The low frequency of thermal stress events in these areas may possibly be due to the complex hydrodynamic processes in these areas (Gordon 2005; Qu et al. 2005). The complex geometry and connectivity through straits and passages coupled with other factors such as surface heat flux, tidal mixing, and monsoonal winds drive the complex distribution of SST in this region (Qu et al. 2005). To investigate changes in thermal stress level for the CT, a temporal analysis of DHW data was performed for pixels known to contain coral reefs. The annual thermal stress levels are shown in Figure 6, which shows that 1998 was the most anomalous year with 77% of the reef pixels having DHW > 0 and 25% with DHW > 4. Higher levels of thermal stress can be observed in as compared to The dramatic increase in the levels of
.")
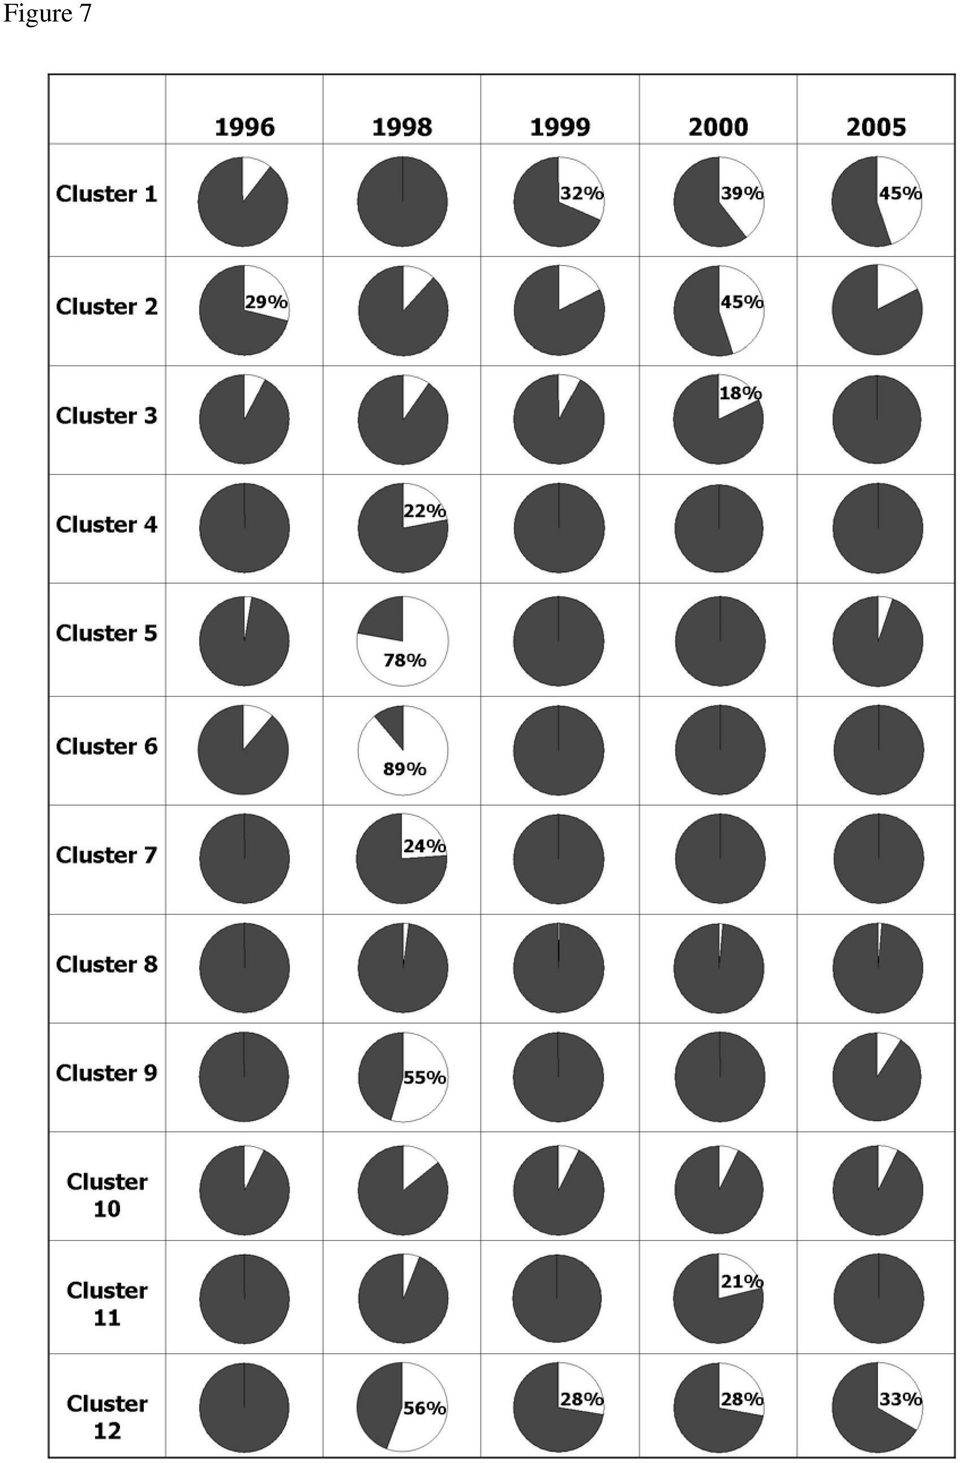
6 thermal stress during the period may have been linked to the Pacific Decadal Oscillation (PDO) reversal in the late 1990s (Strong et al. 2006). The PDO refers to the interdecadal (~2-3 decades) oscillation of Pacific Ocean temperatures between warm and cold phases (Strong et al. 2006; Mantua and Hare 2002). Further analysis was performed on the data from the five years with the highest percentages of reef pixels with DHW > 4: 1996, 1998, 1999, 2000, and 2005 (Figure 7). These years are concurrent with the La Niña events with the exception of 2005, which is an ENSO-neutral year is currently the warmest year on record based on global temperature averages (Shein 2006). In this analysis, only pixels with DHW > 4 were included since this level of thermal stress has been observed to indicate significant bleaching in corals (Skirving et al. 2006; Strong et al. 2006). The year 1998, when a very strong La Niña occurred, again stands out with the most number of clusters showing bleaching-level stress. This further supports the occurrence of widespread bleaching in many parts of the CT in Noticeably, clusters 5 and 6 in the northernmost Philippines are the most impacted during the very strong La Niña. Cluster 1, at the southeastern extent of the CT, is the only cluster that had no reef pixels with bleaching-level thermal stress in The observed SST in that year (Figure 4) was not high enough or sustained for long enough to cause bleachinglevel thermal stress. Clusters 2 and 3 also have lower proportions of reef pixels with this level of thermal stress in 1998 but all three clusters (1, 2, and 3) showed higher percentages of stress in the other four years. Figure 7 also shows that reef pixels in clusters 1, 2, 3, 10, and 12 have more frequent occurrences of bleaching-level thermal stress (DHW > 4) in the selected five years, while the middle latitude clusters, 4 and 7, are among the least frequent. Cluster 8 seemed to be the least affected overall with very low proportions of this level of stress. Overall, this study shows that more warming and more thermal stress events were observed from 1996 onwards as compared to the earlier half of the record. This is likely to be a consequence of climate change, i.e. PDO phase shift superimposed on the warming trend. Results also show the variability of SST in both time and space for various parts of the Coral Triangle. There are areas that are warming up faster but are experiencing less frequent annual SST fluctuations. These areas are also affected by significant levels of thermal stress as in the case of the northern Coral Triangle (particularly clusters 5 and 6). Corals in these areas are likely to be susceptible to future bleaching occurrences if they cannot cope with the rapid increase in SST. There are also areas that afford natural protection from warming events as in the case of the inner seas of Indonesia. Some areas in the southern portion of the region (clusters 1, 10, and 12) have highly fluctuating SSTs accompanied with frequent thermal stress events, and yet exhibit no significant increase in long-term SST. In these areas, corals may be more adapted to warm SST anomalies and more likely to see slower warming in coming decades. Also, more thermal stress occurrences were observed in the easternmost parts of the region (clusters 2 and 3), which may have provided opportunity for the development of corals that are more resilient to thermal stress events. The effect of the faster warming rates on corals located in these areas needs further investigation. The analyses of SSTs and thermal stress in the Coral Triangle portray a significantly varied story. The northern areas are experiencing greater increases in SST through time compared to the southern areas. The eastern parts of the region, on the other hand, show significant increases in thermal stress events compared to the western parts. Lastly, significant bleaching events are more likely to occur in the Coral Triangle during a La Niña, and not during El Niño, with the northern areas more likely affected during a very strong even

7 Acknowledgements This study was supported by the World Bank/GEF Coral Reef Targeted Research program Remote Sensing Working Group with chair Dr. Peter Mumby. The authors are also grateful to Dr. Bruce Maxwell of Colby College, Waterville for his assistance in the clustering analysis and Dr. C. Mark Eakin of NOAA-NESDIS CRW for his invaluable comments on the manuscript. The manuscript contents are solely the opinions of the authors and do not constitute a statement of policy, decision, or position on behalf of NOAA or the U.S. Government. References Allen GR, Werner TB (2002) Coral reef fish assessment in the coral triangle of southeastern Asia. Environ Biol Fish 65: Arthur D, Vassilvitskii S (2007) K-means++: The advantages of careful seeding. Proceedings of the 18th annual ACM-SIAM Symposium on Discrete Algorithms, Barber RT, Chavez FP (1986) Ocean variability in relation to living resources during the El Niño. Nature 319: Berkelmans R, Willis BL (1999) Seasonal and local spatial patterns in the upper thermal limits of corals on the inshore Central Great Barrier Reef. Coral Reefs 18: Berkelmans R, De'ath G, Kininmonth S, Skirving WJ (2004) A comparison of the 1998 and 2002 coral bleaching events on the Great Barrier Reef: spatial correlation, patterns, and predictions. Coral Reefs 23:74-83 Briggs JC (2005) Coral reefs: Conserving the evolutionary sources. Biol Conserv 126: Briggs JC (2007) Marine longitudinal biodiversity: causes and conservation. Divers Distrib 13: Bruno JF, Selig ER, Casey KS, Page CA, Willis BL, Harvell CD, Sweatman H, Melendy AM (2007) Thermal stress and coral cover as drivers of coral disease outbreaks. PLoS Biol 5:e124 [doi: /journal.pbio ] Bruno JF, Selig ER (2007) Regional decline of coral cover in the Indo-Pacific: Timing, extent, and subregional comparisons. PLoS ONE 2:e711 [doi: /journal.pone ] Burke L, Selig E, Spalding M (2002) Reefs at risk in Southeast Asia. World Resources Institute, Washington D.C. Carpenter KE, Springer VG (2005) The center of the center of marine shore fish biodiversity: the Philippine Islands. Environ Biol Fish 72: Carpenter KE, Abrar M, Aeby G, Aronson RB, Banks S, Bruckner A, Chiriboga A, Cortés J, Delbeek JC, DeVantier L, Edgar GJ, Edwards AJ, Fenner D, Guzmán HM, Hoeksema BW, Hodgson G, Johan O, Licuanan WY, Livingstone SR, Lovell ER, Moore JA, Obura DO, Ochavillo D, Polidoro BA, Precht WF, Quibilan MC, Reboton C, Richards ZT, Rogers AD, Sanciangco J, Sheppard A, Sheppard C, Smith J, Stuart S, Turak E, Veron JEN, Wallace C, Weil E, Wood E (2008) One-third of reef-building corals face elevated extinction risk from climate change and local impacts. Science 321: Eakin CM, Lough JM, Heron SF (2009) Climate variability and change: Monitoring data and evidence for increased coral bleaching stress. In: van Oppen M, Lough JM (eds) Coral bleaching: Patterns, processes, causes and consequences. Springer, Heidelberg, pp 41-67
 Coral reef fish assessment in the coral triangle of southeastern Asia.")
8 Edinger EN, Jompa J, Limmon GV, Widjatmoko W, Risk MJ (1998) Reef degradation and coral biodiversity in Indonesia: Effects of land-based pollution, destructive fishing practices and changes over time. Mar Pollut Bull 36: Enfield DB (2001) Evolution and historical perspective of the El Nino-Southern Oscillation event. Bull Mar Sci 69:7-25 Fox HE, Pet JS, Dahuri R, Caldwell RL (2003) Recovery in rubble fields: long-term impacts of blast fishing. Mar Pollut Bull 46: Gordon AL (2005) Oceanography of the Indonesian seas and their throughflow. Oceanography 18:14-27 Green A, Mous PJ (2004) Delineating the Coral Triangle, its ecoregions and functional seascapes. Report on an expert workshop held in Southeast Asia Center for Marine Protected Areas, Bali, Indonesia, April 30-May 2, 2003, The Nature Conservancy Hoegh-Guldberg O (1999) Climate change, coral bleaching and the future of the world's coral reefs. Mar Freshw Res 50: Hoegh-Guldberg O, Mumby PJ, Hooten AJ, Steneck RS, Greenfield P, Gomez E, Harvell DR, Sale PF, Edwards AJ, Caldeira K, Knowlton N, Eakin CM, Iglesias-Prieto R, Muthiga N, Bradbury RH, Dubi A, Hatziolos ME (2007) The carbon crisis: coral reefs under rapid climate change and ocean acidification. Science 318: IPCC (2007) Summary for Policymakers. In: Climate change 2007: Synthesis report. Contribution of working groups I, II and III to the fourth assessment report of the Intergovernmental Panel on Climate Change. IPCC, Switzerland PL, Brown EK (2004) Global warming, regional trends and inshore environmental conditions influence coral bleaching in Hawaii. Global Change Biol 10: [doi: /j x] Kawahata H, Gupta LP (2004) Settling particles flux in response to El Niño/Southern Oscillation (ENSO) in the equatorial Pacific. In: Shiyomi M, Kawahata H, Koizumi H, Tsuda A, Awaya Y (eds) Global environmental change in the ocean and on land. Terrapub, Tokyo, pp Kleypas JA, Danabasoglu G, Lough JM (2008) Potential role of the ocean thermostat in determining regional differences in coral bleaching events. Geophys Res Lett 35: L03613 [doi: /2007gl032257] Liu G, Strong AE, Skirving W (2003) Remote sensing of sea surface temperatures during 2002 Barrier Reef coral bleaching. EOS Trans Am Geophys Union 84: Lough J, Berkelmans R, van Oppen M, Wooldridge S, Steinberg C (2006) The Great Barrier Reef and climate change. Bull Aust Met Oceanogr Soc 19: Mantua NJ, Hare SR (2002) The Pacific Decadal Oscillation. J Oceanogr 58:35-44 McClanahan TR, Ateweberhan M, Graham NAJ, Wilson SK, Sebastian CR, Guillaume MMM, Bruggemann JH (2007) Western Indian Ocean coral communities: bleaching responses and susceptibility to extinction. Mar Ecol Prog Ser 337: 1-13 McGowan JA, DR Cayan, Dorman LM (1998) Climate-ocean variability and ecosystem response in the Northeast Pacific. Science 281: McPhaden MJ (1999) Genesis and evolution of the El Niño. Science 283: McPhaden MJ, Zebiak SE, Glantz MH (2006) ENSO as an integrating concept in Earth science. Science 314: Mora C, Chittaro PM, Sale PF, Kritzer JP, Ludsin SA (2003) Patterns and processes in reef fish diversity. Nature 421: Oliver JK, Berkelmans R, Eakin CM (2009) Coral bleaching in space and time. In: van Oppen M, Lough JM (eds) Coral bleaching: Patterns, processes, causes and consequences. Springer, Heidelberg, pp 21-39
 Oceanography of the Indonesian seas and their throughflow.")
9 Pratchett MS, Wilson SK, Baird AH (2006) Declines in the abundance of Chaetodon butterflyfishes following extensive coral depletion. J Fish Biol 69: [doi: /j ] Qu T, Du Y, Strachan J, Meyers G, Slingo J (2005) Sea surface temperature and its variability in the Indonesian region. Oceanography 18:50-61 Shein, KA (Ed.) 2006 State of the climate in Bull Am Meteorol Soc 87:S1-S102 Skirving W, Strong AE, Liu G, Arzayus F, Liu C, Sapper J (2006) Extreme events and perturbations of coastal ecosystems: Sea surface temperature change and coral bleaching. In: Richardson LL, LeDrew EF (eds). Remote sensing of aquatic coastal ecosystem processes: Science and management applications. Springer, Netherlands, pp Strong AE, Arzayus F, Skirving W, Heron SF (2006) Identifying coral bleaching remotely via Coral Reef Watch Improved integration and implications for changing climate. In: Phinney JT, Hoegh-Guldberg, O, Kleypas J, Skirving W, Strong A (eds). Coral reefs and climate change: Science and management, coastal and estuarine studies 61, American Geophysical Union, Washington, D.C., pp Wilkinson C (ed) (1998) Status of coral reefs of the world: Australian Institute of Marine Science, Townsville, Queensland, Australia Wilkinson C (ed) (2004) Status of the coral reefs of the world: Australian Institute of Marine Science, Townsville, Queensland, Australia
. Remote sensing of aquatic coastal ecosystem processes: Science and management applications.")
10 Figure Legends Figure 1. Map of the Coral Triangle region. Solid line depicts border after Green and Mous (2004) and J.E.N. Veron (pers. comm.). The broken line represents the 200-km buffer zone extension used in this study. The gray polygon near Papua New Guinea represents the western end of the western Pacific warm pool (after Kleypas et al. 2008) Figure 2. Average sea surface temperatures (annual maximum, mean, and minimum) for the entire study area for the period Arrows indicate Mt. Pinatubo eruption (1991) and strong El Niño/La Niña events (1998). Boxes indicate one standard deviation around mean (in broken, horizontal line) Figure 3. Trends in sea surface temperature within each 0.5 o x 0.5 o pixel for the period calculated from biweekly data. Figure 4. The Coral Triangle divided into 12 clusters. Graphs show the annual mean SST for each cluster with horizontal line indicating the mean of the biweekly SST for all years. Figure 5. Maps of the return frequency of thermal stress events reaching two thresholds, DHW > 0 (left) and DHW > 4 (right). Upper images show the frequency of stress event occurrences from while lower images depict years from Some pixels show multiple event occurrences within a year, indicated by values greater than 11. Figure 6. Annual percentages of all known reef-containing pixels in the entire Coral Triangle reaching thermal stress thresholds of DHW > 0 (left) and DHW > 4 (right). Figure 7. Percentages of reef pixels (white portion in each pie chart) for each cluster with DHW > 4 during selected years.
 and strong El Niño/La Niña events (1998). Boxes indicate one standard deviation around 1985-2006 mean (in broken, horizontal line) Figure 3.")
11 Figure 1 Figure 2

12 Figure 3

13 Figure 4
14 Figure 5 Figure 6

15 Figure 7
Sea-surface temperature and thermal stress in the Coral Triangle over the past two decades
 Coral Reefs (2009) 28:841 850 DOI 10.1007/s00338-009-0522-8 REPORT Sea-surface temperature and thermal stress in the Coral Triangle over the past two decades E. L. Peñaflor Æ W. J. Skirving Æ A. E. Strong
Coral Bleaching Alert System
 Coral Bleaching Alert System Technical Document Indian National Centre for Ocean Information Services (INCOIS) Hyderabad 2011 Contents Page No. 1. Introduction...1 1. Objective...2 2. Study Area...2 3.
Coral Reef Watch A Satellite View. AE Strong. Satellite SST Anomalies. January 2002 May 2003
 Coral Reef Watch A Satellite View AE Strong Satellite SST Anomalies January 2002 May 2003 Coral Reefs, Climate, and Coral Bleaching Workshop June 18-20, 2003 Turtle Bay, Oahu, HI NOAA s Program Leaders:
ENSO: Recent Evolution, Current Status and Predictions. Update prepared by: Climate Prediction Center / NCEP 29 June 2015
 ENSO: Recent Evolution, Current Status and Predictions Update prepared by: Climate Prediction Center / NCEP 29 June 2015 Outline Summary Recent Evolution and Current Conditions Oceanic Niño Index (ONI)
IGAD CLIMATE PREDICTION AND APPLICATION CENTRE
 IGAD CLIMATE PREDICTION AND APPLICATION CENTRE CLIMATE WATCH REF: ICPAC/CW/No.32 May 2016 EL NIÑO STATUS OVER EASTERN EQUATORIAL OCEAN REGION AND POTENTIAL IMPACTS OVER THE GREATER HORN OF FRICA DURING
Satellite Observation of Heavily Lit Fishing Boat Activity in the Coral Triangle Region
 Satellite Observation of Heavily Lit Fishing Boat Activity in the Coral Triangle Region Christopher D. Elvidge Earth Observation Group NOAA National Geophysical Data Center E-mail: chris.elvidge@noaa.gov
Underwater gliders reveal rapid arrival of El Niño effects off California s coast
 GEOPHYSICAL RESEARCH LETTERS, VOL. 38,, doi:10.1029/2010gl046376, 2011 Underwater gliders reveal rapid arrival of El Niño effects off California s coast Robert E. Todd, 1 Daniel L. Rudnick, 1 Russ E. Davis,
ENSO Cycle: Recent Evolution, Current Status and Predictions. Update prepared by Climate Prediction Center / NCEP 9 May 2011
 ENSO Cycle: Recent Evolution, Current Status and Predictions Update prepared by Climate Prediction Center / NCEP 9 May 2011 Outline Overview Recent Evolution and Current Conditions Oceanic Niño Index (ONI)
PLEASE SCROLL DOWN FOR ARTICLE
 PLEASE SCROLL DOWN FOR ARTICLE Full terms and conditions of use: http://www.informaworld.com/terms-and-conditions-of-access.pdf This article may be used for research, teaching and private study purposes.
Climate Change and Coral Bleaching in Puerto Rico: Efforts and Challenges
 Climate Change and Coral Bleaching in Puerto Rico: Efforts and Challenges June 18-20, 2003 Oahu, Hawaii 1 2 Aileen T. Velazco-Domínguez, MS Puerto Rico Department of Natural and Environmental Resources
GREAT BARRIER REEF. Climate Change Action Plan
 GREAT BARRIER REEF Climate Change Action Plan 2007 2011 Climate change is now recognised as the greatest long-term threat to the Great Barrier Reef. The Great Barrier Reef is internationally renowned as
Temporal variation in snow cover over sea ice in Antarctica using AMSR-E data product
 Temporal variation in snow cover over sea ice in Antarctica using AMSR-E data product Michael J. Lewis Ph.D. Student, Department of Earth and Environmental Science University of Texas at San Antonio ABSTRACT
Climate Change on the Prairie:
 Climate Change on the Prairie: A Basic Guide to Climate Change in the High Plains Region - UPDATE Global Climate Change Why does the climate change? The Earth s climate has changed throughout history and
Present Status of Coastal Environmental Monitoring in Korean Waters. Using Remote Sensing Data
 Present Status of Coastal Environmental Monitoring in Korean Waters Using Remote Sensing Data Sang-Woo Kim, Young-Sang Suh National Fisheries Research & Development Institute #408-1, Shirang-ri, Gijang-up,
Symbiosis: Responding to Coral Bleaching in the Two Samoas
 Symbiosis: Responding to Coral Bleaching in the Two Samoas Coral reefs get their structure from calcium carbonate skeletons built by individual corals (animals) which take many shapes and their colors
How To Understand Cloud Radiative Effects
 A Climatology of Surface Radiation, Cloud Cover, and Cloud Radiative Effects for the ARM Tropical Western Pacific Sites. Chuck Long, Casey Burleyson, Jennifer Comstock, Zhe Feng September 11, 2014 Presented
Radiative effects of clouds, ice sheet and sea ice in the Antarctic
 Snow and fee Covers: Interactions with the Atmosphere and Ecosystems (Proceedings of Yokohama Symposia J2 and J5, July 1993). IAHS Publ. no. 223, 1994. 29 Radiative effects of clouds, ice sheet and sea
Slide 1. Slide 2. Slide 3
 Satellite Analysis of Sea Surface Temperatures in the Florida Keys to Monitor Coral Reef Health NASA Stennis Space Center Earthzine/DEVELOP Virtual Poster Session, Summer 2011 Video Transcript Slide 1
Huai-Min Zhang & NOAAGlobalTemp Team
 Improving Global Observations for Climate Change Monitoring using Global Surface Temperature (& beyond) Huai-Min Zhang & NOAAGlobalTemp Team NOAA National Centers for Environmental Information (NCEI) [formerly:
Scholar: Elaina R. Barta. NOAA Mission Goal: Climate Adaptation and Mitigation
 Development of Data Visualization Tools in Support of Quality Control of Temperature Variability in the Equatorial Pacific Observed by the Tropical Atmosphere Ocean Data Buoy Array Abstract Scholar: Elaina
Near Real Time Blended Surface Winds
 Near Real Time Blended Surface Winds I. Summary To enhance the spatial and temporal resolutions of surface wind, the remotely sensed retrievals are blended to the operational ECMWF wind analyses over the
Dr. Gary S. E. Lagerloef Earth and Space Research, 1910 Fairview Ave E
 Establishing a NOAA Operational Data Center for Surface Currents Derived from Satellite Altimeters and Scatterometers; Pilot Study for the Tropical Pacific Including the Hawaiian Islands and US Territorial
Climate Extremes Research: Recent Findings and New Direc8ons
 Climate Extremes Research: Recent Findings and New Direc8ons Kenneth Kunkel NOAA Cooperative Institute for Climate and Satellites North Carolina State University and National Climatic Data Center h#p://assessment.globalchange.gov
Daily High-resolution Blended Analyses for Sea Surface Temperature
 Daily High-resolution Blended Analyses for Sea Surface Temperature by Richard W. Reynolds 1, Thomas M. Smith 2, Chunying Liu 1, Dudley B. Chelton 3, Kenneth S. Casey 4, and Michael G. Schlax 3 1 NOAA National
NOAA Technical Report NESDIS 143
 NOAA Technical Report NESDIS 143 NOAA Coral Reef Watch 50 km Satellite Sea Surface Temperature-Based Decision Support System for Coral Bleaching Management Washington, D.C. March 2013 U.S. DEPARTMENT OF
THE CURIOUS CASE OF THE PLIOCENE CLIMATE. Chris Brierley, Alexey Fedorov and Zhonghui Lui
 THE CURIOUS CASE OF THE PLIOCENE CLIMATE Chris Brierley, Alexey Fedorov and Zhonghui Lui Outline Introduce the warm early Pliocene Recent Discoveries in the Tropics Reconstructing the early Pliocene SSTs
The Dynamics of Coral Disease and Bleaching
 The Dynamics of Coral Disease and Bleaching Coral reefs of the Caribbean have been severely degraded over the last few decades through the impacts of coral diseases and bleaching (Gladfelter 1982, Gardener
Jessica Blunden, Ph.D., Scientist, ERT Inc., Climate Monitoring Branch, NOAA s National Climatic Data Center
 Kathryn Sullivan, Ph.D, Acting Under Secretary of Commerce for Oceans and Atmosphere and NOAA Administrator Thomas R. Karl, L.H.D., Director,, and Chair of the Subcommittee on Global Change Research Jessica
California Standards Grades 9 12 Boardworks 2009 Science Contents Standards Mapping
 California Standards Grades 912 Boardworks 2009 Science Contents Standards Mapping Earth Sciences Earth s Place in the Universe 1. Astronomy and planetary exploration reveal the solar system s structure,
The Marine Protected Area Inventory
 The Marine Protected Area Inventory New pictures Jordan Gass, Hugo Selbie and Charlie Wahle ESRI Ocean Forum November 6, 2013 Outline What is the MPA Inventory? Purpose Data How it s used Future directions
Coral Bleaching. Ann-Tin Cheng, ID#0628482 Cathy Wu, ID#0633019
 Coral Bleaching Ann-Tin Cheng, ID#0628482 Cathy Wu, ID#0633019 1. Elevated/ Decreased Sea Water Temperature Causes 2. 3. Solar Irradiance Subaerial Exposure 4. Sedimentation 5. Fresh Water Dilution 6.
Coral Triangle Initiative (CTI) on Coral Reefs, Fisheries and Food Securities
 on Coral Reefs, Fisheries and Food Securities") 2008/MRCWG/022 Agenda Item: 10 Coral Triangle Initiative (CTI) on Coral Reefs, Fisheries and Food Securities Purpose: Information Submitted by: Indonesia 21 st Marine Resource Conservation Working Group
2008/MRCWG/022 Agenda Item: 10 Coral Triangle Initiative (CTI) on Coral Reefs, Fisheries and Food Securities Purpose: Information Submitted by: Indonesia 21 st Marine Resource Conservation Working Group
II. Related Activities
 (1) Global Cloud Resolving Model Simulations toward Numerical Weather Forecasting in the Tropics (FY2005-2010) (2) Scale Interaction and Large-Scale Variation of the Ocean Circulation (FY2006-2011) (3)
Views from Living Marine Resources Management and the Coral Triangle Project
 Views from Living Marine Resources Management and the Coral Triangle Project Annadel Salvio Cabanban Ecosystem Approach to Fisheries Management Specialist, Coral Triangle Initiative Southeast Asia Project:
18. USING SEA SURFACE TEMPERATURE TO ASSESS CORAL BLEACHING RISK
 18. USING SEA SURFACE TEMPERATURE TO ASSESS CORAL BLEACHING RISK By: Yohanna W. Shaghude 1 and Valborg Byfield 2 18.1. Introduction and relevance of application Coral reefs are considered the oceanic equivalent
South Africa. General Climate. UNDP Climate Change Country Profiles. A. Karmalkar 1, C. McSweeney 1, M. New 1,2 and G. Lizcano 1
 UNDP Climate Change Country Profiles South Africa A. Karmalkar 1, C. McSweeney 1, M. New 1,2 and G. Lizcano 1 1. School of Geography and Environment, University of Oxford. 2. Tyndall Centre for Climate
How To Predict Climate Change In Tonga
 Niuatoputapu Niuafo'ou Late Island Vava u Group South Pacific Ocean Tofua Island Kotu Group Nomuka Group Ha apai Group NUKU ALOFA Eua Island Tongatapu Group Current and future climate of Tonga > Tonga
THE CORAL TRIANGLE INITIATIVE ON CORAL REEFS, FISHERIES AND FOOD SECURITY
 THE CORAL TRIANGLE INITIATIVE ON CORAL REEFS, FISHERIES AND FOOD SECURITY Designing and Operating MPA Networks and Systems in the Coral Triangle Countries Regional Exchange and Workshop in Support of the
A high- resolu-on regional model for the Coral Triangle
 A high- resolu-on regional model for the Coral Triangle Frédéric Castruccio Rutgers University & NCAR, USA Enrique Curchitser Rutgers University, USA Joanie Kleypas NCAR, USA Zack Powell University California
Examining the Recent Pause in Global Warming
 Examining the Recent Pause in Global Warming Global surface temperatures have warmed more slowly over the past decade than previously expected. The media has seized this warming pause in recent weeks,
Fundamentals of Climate Change (PCC 587): Water Vapor
: Water Vapor") Fundamentals of Climate Change (PCC 587): Water Vapor DARGAN M. W. FRIERSON UNIVERSITY OF WASHINGTON, DEPARTMENT OF ATMOSPHERIC SCIENCES DAY 2: 9/30/13 Water Water is a remarkable molecule Water vapor
Fundamentals of Climate Change (PCC 587): Water Vapor DARGAN M. W. FRIERSON UNIVERSITY OF WASHINGTON, DEPARTMENT OF ATMOSPHERIC SCIENCES DAY 2: 9/30/13 Water Water is a remarkable molecule Water vapor
Alan White The Nature Conservancy
 The Coral Triangle Region, The Coral Triangle Initiative, and the Development of the Six Country Marine Protected Area System Alan White The Nature Conservancy The Coral Triangle Initiative Coral Triangle
Assessing risks to ecosystems - a new global standard
 Assessing risks to ecosystems - a new global standard IUCN Ecosystem Red List Working Group David Keith et al. Major scientific challenges I. What is an ecosystem? II. When is an ecosystem extinct? disappearance
163 ANALYSIS OF THE URBAN HEAT ISLAND EFFECT COMPARISON OF GROUND-BASED AND REMOTELY SENSED TEMPERATURE OBSERVATIONS
 ANALYSIS OF THE URBAN HEAT ISLAND EFFECT COMPARISON OF GROUND-BASED AND REMOTELY SENSED TEMPERATURE OBSERVATIONS Rita Pongrácz *, Judit Bartholy, Enikő Lelovics, Zsuzsanna Dezső Eötvös Loránd University,
THE CORAL TRIANGLE AND CLIMATE CHANGE: ECOSYSTEMS, PEOPLE AND SOCIETIES AT RISK
 THE CORAL TRIANGLE AND CLIMATE CHANGE: ECOSYSTEMS, PEOPLE AND SOCIETIES AT RISK A COMPREHENSIVE STUDY INVOLVING OVER 20 EXPERTS AND BASED ON 300 PEER-REVIEWED SCIENTIFIC ARTICLES First published in May
Progress Towards the Development of the Six Country Coral Triangle Marine Protected Area System (CTMPAS)
") Progress Towards the Development of the Six Country Coral Triangle Marine Protected Area System (CTMPAS) Alan White Senior Scientist, The Nature Conservancy and Lynette Laroya MPA Technical Working Group,
Progress Towards the Development of the Six Country Coral Triangle Marine Protected Area System (CTMPAS) Alan White Senior Scientist, The Nature Conservancy and Lynette Laroya MPA Technical Working Group,
Reply to No evidence for iris
 Reply to No evidence for iris Richard S. Lindzen +, Ming-Dah Chou *, and Arthur Y. Hou * March 2002 To appear in Bulletin of the American Meteorological Society +Department of Earth, Atmospheric, and Planetary
Integrating Near Real-Time Data for Coral Reef Ecosystem Forecasting
 Integrating Near Real-Time Data for Coral Reef Ecosystem Forecasting NOAA s Integrated Coral Observing Network (ICON) Atlantic Oceanographic and Meteorological Laboratory Laboratory Review, March 18, 2008
Satellite SST Product Development Proposal
 Call for Proposals under the IMOS (EIF) Five Year Strategy: Enhancement or extension of IMOS July 2009 to June 2013 Satellite SST Products Sub-Facility Plan Overview: Proposed Infrastructure Investment:
CORAL REEFS AND HURRICANES IN 2005. edited by Clive Wilkinson and David Souter
 STATUS STATUS OF CARIBBEAN OF CORAL REEFS OFAFTER THE WORLD: BLEACHING 2008 AND HURRICANES IN 2005 edited by Clive edited Wilkinson by Clive Wilkinson and David Souter Expert opinion i of 372 coral reef
IMPACTS OF IN SITU AND ADDITIONAL SATELLITE DATA ON THE ACCURACY OF A SEA-SURFACE TEMPERATURE ANALYSIS FOR CLIMATE
 INTERNATIONAL JOURNAL OF CLIMATOLOGY Int. J. Climatol. 25: 857 864 (25) Published online in Wiley InterScience (www.interscience.wiley.com). DOI:.2/joc.68 IMPACTS OF IN SITU AND ADDITIONAL SATELLITE DATA
PROJECT SUPPORT 2012 INTERNATIONAL CORAL REEF SYMPOSIUM
 207 ORDINARY MEETING 22 JUNE 2011 13 PROJECT SUPPORT 2012 INTERNATIONAL CORAL REEF SYMPOSIUM Fiona Wilson/ Stefanie Wilson: 1/59/1-01: #3205573 RECOMMENDATION: That Council approves financial support of
2008 Global Surface Temperature in GISS Analysis
 2008 Global Surface Temperature in GISS Analysis James Hansen, Makiko Sato, Reto Ruedy, Ken Lo Calendar year 2008 was the coolest year since 2000, according to the Goddard Institute for Space Studies analysis
Queensland rainfall past, present and future
 Queensland rainfall past, present and future Historically, Queensland has had a variable climate, and recent weather has reminded us of that fact. After experiencing the longest drought in recorded history,
Climate Change Long Term Trends and their Implications for Emergency Management August 2011
 Climate Change Long Term Trends and their Implications for Emergency Management August 2011 Overview A significant amount of existing research indicates that the world s climate is changing. Emergency
PMEL Press Releases and NOAA News Stories FY09- FY14
 PMEL Press Releases and NOAA News Stories FY09- FY14 PMEL WIDE Oceanographer named to head NOAA s Seattle research laboratory http://www.noaanews.noaa.gov/stories2011/20111018_pmel.html CLIMATE THEME most
Seasonal & Daily Temperatures. Seasons & Sun's Distance. Solstice & Equinox. Seasons & Solar Intensity
 Seasonal & Daily Temperatures Seasons & Sun's Distance The role of Earth's tilt, revolution, & rotation in causing spatial, seasonal, & daily temperature variations Please read Chapter 3 in Ahrens Figure
Straits of Mackinac Contaminant Release Scenarios: Flow Visualization and Tracer Simulations
 Straits of Mackinac Contaminant Release Scenarios: Flow Visualization and Tracer Simulations Research Report for the National Wildlife Federation Great Lakes Regional Center By David J. Schwab, Ph.D.,
Monsoon Variability and Extreme Weather Events
 Monsoon Variability and Extreme Weather Events M Rajeevan National Climate Centre India Meteorological Department Pune 411 005 rajeevan@imdpune.gov.in Outline of the presentation Monsoon rainfall Variability
21st International Conference of The Coastal Society
 21st International Conference of The Coastal Society KNOWLEDGE DIFFUSION IN TWO MARINE PROTECTED AREA NETWORKS IN THE CENTRAL VISAYAS REGION, PHILIPPINES Diana M. Pietri, School of Marine Affairs, University
Indian Ocean and Monsoon
 Indo-French Workshop on Atmospheric Sciences 3-5 October 2013, New Delhi (Organised by MoES and CEFIPRA) Indian Ocean and Monsoon Satheesh C. Shenoi Indian National Center for Ocean Information Services
Projecting climate change in Australia s marine environment Kathleen McInnes
 Projecting climate change in Australia s marine environment Kathleen McInnes CSIRO Oceans and Atmosphere Flagship Centre for Australian Climate and Weather Research Framing of the problem IMPACTS EMISSIONS
DIURNAL CYCLE OF CLOUD SYSTEM MIGRATION OVER SUMATERA ISLAND
 DIURNAL CYCLE OF CLOUD SYSTEM MIGRATION OVER SUMATERA ISLAND NAMIKO SAKURAI 1, FUMIE MURATA 2, MANABU D. YAMANAKA 1,3, SHUICHI MORI 3, JUN-ICHI HAMADA 3, HIROYUKI HASHIGUCHI 4, YUDI IMAN TAUHID 5, TIEN
Real-time Ocean Forecasting Needs at NCEP National Weather Service
 Real-time Ocean Forecasting Needs at NCEP National Weather Service D.B. Rao NCEP Environmental Modeling Center December, 2005 HYCOM Annual Meeting, Miami, FL COMMERCE ENVIRONMENT STATE/LOCAL PLANNING HEALTH
El Niño-Southern Oscillation (ENSO): Review of possible impact on agricultural production in 2014/15 following the increased probability of occurrence
: Review of possible impact on agricultural production in 2014/15 following the increased probability of occurrence") El Niño-Southern Oscillation (ENSO): Review of possible impact on agricultural production in 2014/15 following the increased probability of occurrence EL NIÑO Definition and historical episodes El Niño
El Niño-Southern Oscillation (ENSO): Review of possible impact on agricultural production in 2014/15 following the increased probability of occurrence EL NIÑO Definition and historical episodes El Niño
Climate Change Strategy and Implementation Plan
 Climate Change Strategy and Implementation Plan 2014-2016 Executive Summary The Climate Change Strategy and Implementation Plan refines and builds upon the Coral Reef Conservation Program Goals and Objectives
Global Seasonal Phase Lag between Solar Heating and Surface Temperature
 Global Seasonal Phase Lag between Solar Heating and Surface Temperature Summer REU Program Professor Tom Witten By Abstract There is a seasonal phase lag between solar heating from the sun and the surface
Lecture 4: Pressure and Wind
 Lecture 4: Pressure and Wind Pressure, Measurement, Distribution Forces Affect Wind Geostrophic Balance Winds in Upper Atmosphere Near-Surface Winds Hydrostatic Balance (why the sky isn t falling!) Thermal
The Oceans Role in Climate
 The Oceans Role in Climate Martin H. Visbeck A Numerical Portrait of the Oceans The oceans of the world cover nearly seventy percent of its surface. The largest is the Pacific, which contains fifty percent
Victims Compensation Claim Status of All Pending Claims and Claims Decided Within the Last Three Years
 Claim#:021914-174 Initials: J.T. Last4SSN: 6996 DOB: 5/3/1970 Crime Date: 4/30/2013 Status: Claim is currently under review. Decision expected within 7 days Claim#:041715-334 Initials: M.S. Last4SSN: 2957
NORTHWESTERN HAWAIIAN ISLANDS SPATIAL BIBLIOGRAPHY: A SCIENCE-PLANNING TOOL ABSTRACT
 NORTHWESTERN HAWAIIAN ISLANDS SPATIAL BIBLIOGRAPHY: A SCIENCE-PLANNING TOOL BY Christine Taylor 1 and David Moe Nelson 1 ABSTRACT The Northwestern Hawaiian Islands Spatial Bibliography (NWHI-SB) is a science-planning
ON CORAL REEFS, FISHERIES
 CORAL TRIANGLE INITIATIVE (CTI) ON CORAL REEFS, FISHERIES AND FOOD SECURITIES By: Cherryta Yunia Director General for Forest Protection and Nature Conservation Ministry of Forestry The Republic of Indonesia
Climate Change Impacts in the Asia/Pacific Region
 Climate Change Impacts in the Asia/Pacific Region Global CC threat CC in the A/P region The Stern Review and IPCC 4 th Assessment Report both state that climate change will have adverse impact on people
2. The map below shows high-pressure and low-pressure weather systems in the United States.
 1. Which weather instrument has most improved the accuracy of weather forecasts over the past 40 years? 1) thermometer 3) weather satellite 2) sling psychrometer 4) weather balloon 6. Wind velocity is
Heavy Rainfall from Hurricane Connie August 1955 By Michael Kozar and Richard Grumm National Weather Service, State College, PA 16803
 Heavy Rainfall from Hurricane Connie August 1955 By Michael Kozar and Richard Grumm National Weather Service, State College, PA 16803 1. Introduction Hurricane Connie became the first hurricane of the
Comment on "Observational and model evidence for positive low-level cloud feedback"
 LLNL-JRNL-422752 Comment on "Observational and model evidence for positive low-level cloud feedback" A. J. Broccoli, S. A. Klein January 22, 2010 Science Disclaimer This document was prepared as an account
The IPCC Special Report on Managing the Risks of Extreme Events and Disasters to Advance Climate Change Adaptation
 The IPCC Special Report on Managing the Risks of Extreme Events and Disasters to Advance Climate Change Adaptation A changing climate leads to changes in extreme weather and climate events 2 How do changes
How To Help Oceans
 The World Bank & the Ocean A Healthy & Productive Ocean to Help Reduce Poverty Why oceans matter to the World Bank NUTRITION Seafood provides 16% of the world s animal protein 1 billion people in developing
Earth Sciences -- Grades 9, 10, 11, and 12. California State Science Content Standards. Mobile Climate Science Labs
 Earth Sciences -- Grades 9, 10, 11, and 12 California State Science Content Standards Covered in: Hands-on science labs, demonstrations, & activities. Investigation and Experimentation. Lesson Plans. Presented
Overview of the US Coral Triangle Initiative Support Program Climate Change Adaptation
 Overview of the US Coral Triangle Initiative Support Program Climate Change Adaptation Britt Parker NOAA Coral Reef Conservation Program rramos 2007 Coral Triangle Initiative & Region www.coraltriangleinitiative.org
James Hansen, Reto Ruedy, Makiko Sato, Ken Lo
 If It s That Warm, How Come It s So Damned Cold? James Hansen, Reto Ruedy, Makiko Sato, Ken Lo The past year, 2009, tied as the second warmest year in the 130 years of global instrumental temperature records,
Impact of the 2010 mass coral bleaching event on Tobago s Reefs
 Impact of the 2010 mass coral bleaching event on Tobago s Reefs Jahson B. Alemu I Environmental Research Programme Crown Plaza, Port of Spain September 2012 What are corals? Coral reefs Coral reefs are
CONFEDERATION OF ASIA-PACIFIC CHAMBERS OF COMMERCE AND INDUSTRY (CACCI)
") CONFEDERATION OF ASIA-PACIFIC CHAMBERS OF COMMERCE AND INDUSTRY (CACCI) Policy Paper on Flexible Responses to Environmental Uncertainty and Infrastructure Resolved as of 3 rd October,. A. BACKGROUND 1.
CONFEDERATION OF ASIA-PACIFIC CHAMBERS OF COMMERCE AND INDUSTRY (CACCI) Policy Paper on Flexible Responses to Environmental Uncertainty and Infrastructure Resolved as of 3 rd October,. A. BACKGROUND 1.
CoralWatch a flexible coral bleaching monitoring tool for you and your group
 Proceedings of the th International Coral Reef Symposium, Ft. Lauderdale, Florida, 7- July 008 Session number CoralWatch a flexible coral bleaching monitoring tool for you and your group U.E. Siebeck,
THE SEARCH FOR T RENDS IN A GLOBAL CATALOGUE
 THE SEARCH FOR T RENDS IN A GLOBAL CATALOGUE OF NORMALIZED W EATHER-RELATED CATASTROPHE LOSSES Robert-Muir Wood, Stuart Miller, Auguste Boissonade Risk Management Solutions London, UK Abstract I n order
Cloud-SST feedback in southeastern tropical Atlantic anomalous events
 Click Here for Full Article JOURNAL OF GEOPHYSICAL RESEARCH, VOL. 112,, doi:10.1029/2006jc003626, 2007 Cloud-SST feedback in southeastern tropical Atlantic anomalous events Bohua Huang 1,2 and Zeng-Zhen
Using LIDAR to monitor beach changes: Goochs Beach, Kennebunk, Maine
 Geologic Site of the Month February, 2010 Using LIDAR to monitor beach changes: Goochs Beach, Kennebunk, Maine 43 o 20 51.31 N, 70 o 28 54.18 W Text by Peter Slovinsky, Department of Agriculture, Conservation
1. Introduction. 2. Coral bleaching
 NATURE FOUNDATION St. Maarten Nature Foundation Coral Bleaching Response Plan Mailing address P. O. Box 863 Philipsburg St. Maarten Netherlands Antilles Physical address Wellsberg Street 1 A Unit 25 26
Mangrove loss faster than land-based forests
 ESL ENGLISH LESSON (60-120 mins) 10 th August 2010 Mangrove loss faster than land-based forests Mangrove forests are disappearing faster than land-based forests according to a new United Nations report
Extra-Tropical Cyclones in a Warming Climate:
 Extra-Tropical Cyclones in a Warming Climate: Observational Evidence of Trends in Frequencies and Intensities in the North Pacific, North Atlantic, & Great Lakes Regions David Levinson Scientific Services
SLOW ONSET EVENTS. climate change impacts on BIODIVERSITY
 Regional Gateway for Technology Transfer and Climate Change Action in Latin America and the Caribbean (ROLAC UNEP) Characterizing and addressing SLOW ONSET EVENTS climate change impacts on BIODIVERSITY
Development of an Integrated Data Product for Hawaii Climate
 Development of an Integrated Data Product for Hawaii Climate Jan Hafner, Shang-Ping Xie (PI)(IPRC/SOEST U. of Hawaii) Yi-Leng Chen (Co-I) (Meteorology Dept. Univ. of Hawaii) contribution Georgette Holmes
FDOU Project 26B Task 4 Our Florida Reefs Community Working Group Scenario Planning Results
 FDOU Project 26B Task 4 Our Florida Reefs Community Working Group Scenario Planning Results Florida Department of Environmental Protection Coral Reef Conservation Program Project 26B FDOU Project 26B Task
Intra-seasonal and Annual variability of the Agulhas Current from satellite observations
 Intra-seasonal and Annual variability of the Agulhas Current from satellite observations Marjolaine Krug Ecosystem Earth Observation (CSIR NRE) Pierrick Penven Laboratoire de Physique des Océans (IRD)
GLACier-fed rivers, HYDRoECOlogy and climate change; NETwork of monitoring sites (GLAC-HYDRECO-NET).
.") Arctic Observing Summit 2013 Statement Glacier-fed rivers GLACier-fed rivers, HYDRoECOlogy and climate change; NETwork of monitoring sites (GLAC-HYDRECO-NET). Alexander Milner, School of Geography, Earth
Arctic Observing Summit 2013 Statement Glacier-fed rivers GLACier-fed rivers, HYDRoECOlogy and climate change; NETwork of monitoring sites (GLAC-HYDRECO-NET). Alexander Milner, School of Geography, Earth
Climate, water and renewable energy in the Nordic countries
 102 Regional Hydrological Impacts of Climatic Change Hydroclimatic Variability (Proceedings of symposium S6 held during the Seventh IAHS Scientific Assembly at Foz do Iguaçu, Brazil, April 2005). IAHS
Data Sets of Climate Science
 The 5 Most Important Data Sets of Climate Science Photo: S. Rahmstorf This presentation was prepared on the occasion of the Arctic Expedition for Climate Action, July 2008. Author: Stefan Rahmstorf, Professor
FURTHER DISCUSSION ON: TREE-RING TEMPERATURE RECONSTRUCTIONS FOR THE PAST MILLENNIUM
 1 FURTHER DISCUSSION ON: TREE-RING TEMPERATURE RECONSTRUCTIONS FOR THE PAST MILLENNIUM Follow-up on the National Research Council Meeting on "Surface Temperature Reconstructions for the Past 1000-2000
IEAGHG Information Paper 2015-10; The Earth s Getting Hotter and So Does the Scientific Debate
 IEAGHG Information Paper 2015-10; The Earth s Getting Hotter and So Does the Scientific Debate A recent study published in Nature Climate Change 1 suggests that the rate of climate change we're experiencing